Fig. 3
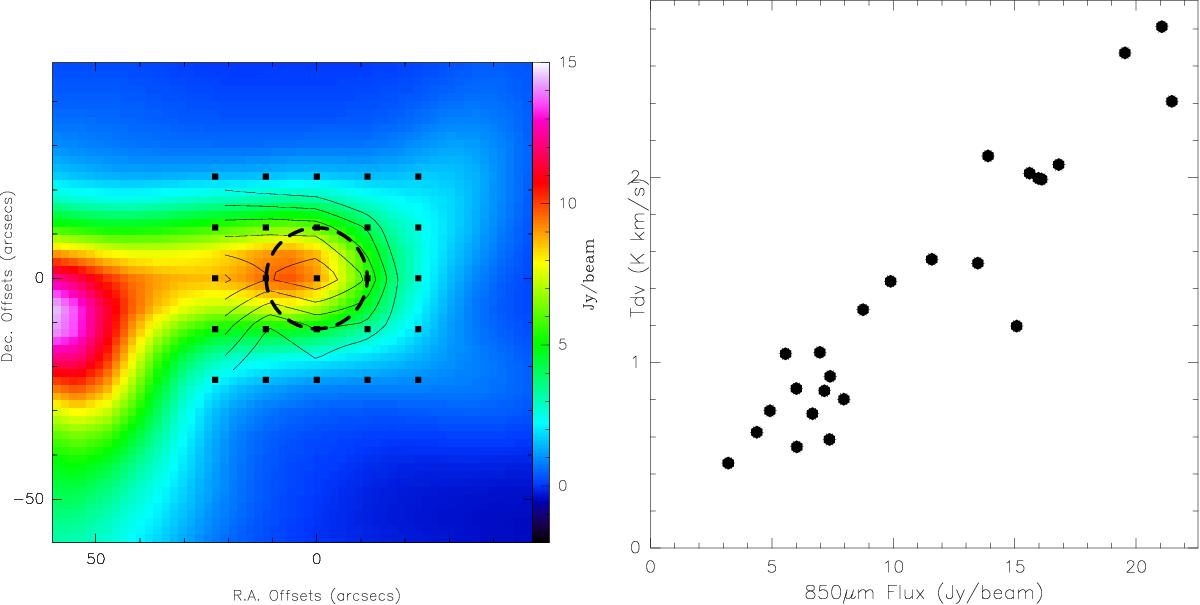
Left: SCUBA 850 μm dust continuum archival data (colorscale) and CN intensity integrated over the 113 170.49 MHz hyperfine from 34 to 42 km s-1 (contours, 1.2 to 4 in steps of 0.3 K km s-1). The offsets positions for the CN map and the IRAM 30 m beam are shown as black squares and dashed circle respectively. Right: correlation plot of 850 μm flux (smoothed to 23.5′′) and CN integrated intensity.
Current usage metrics show cumulative count of Article Views (full-text article views including HTML views, PDF and ePub downloads, according to the available data) and Abstracts Views on Vision4Press platform.
Data correspond to usage on the plateform after 2015. The current usage metrics is available 48-96 hours after online publication and is updated daily on week days.
Initial download of the metrics may take a while.