Fig. 3
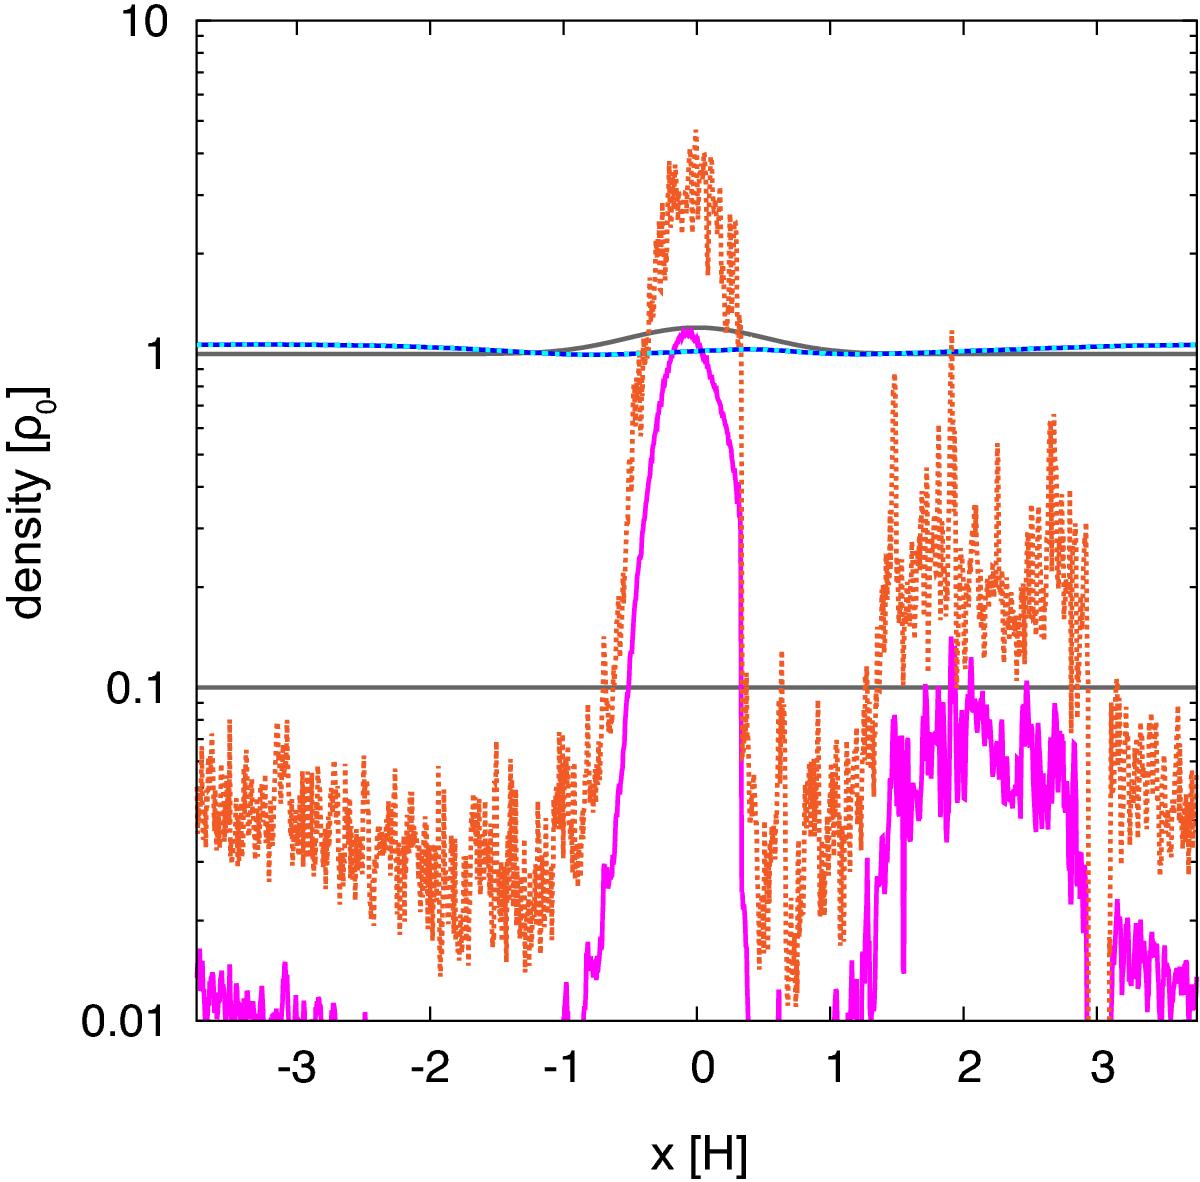
Dust and gas density radial profile from run β04-2D (2D w/bump). Each line is a snapshot at tΩ = 500. Gray solid lines show the initial profile of gas (upper line) and dust (lower line) densities. The orange dotted line and the magenta solid lines show the highest and vertically averaged dust densities at each x. The vertically averaged dust density stays at ~ 1 as in the 1D run, while the upward deviation of the orange line from the pink one shows the growth of SI in the 2D case. The cyan solid and blue dotted lines showing the gas densities (highest and vertically averaged, respectively) show small differences that imply that the gas density has a nearly uniform distribution in the vertical direction.
Current usage metrics show cumulative count of Article Views (full-text article views including HTML views, PDF and ePub downloads, according to the available data) and Abstracts Views on Vision4Press platform.
Data correspond to usage on the plateform after 2015. The current usage metrics is available 48-96 hours after online publication and is updated daily on week days.
Initial download of the metrics may take a while.