Fig. 2
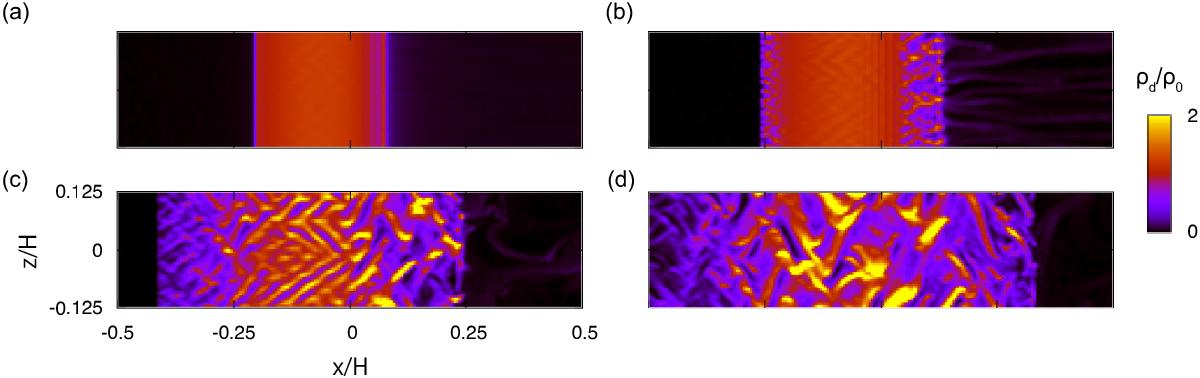
Dust-density pattern obtained from run β04-2D (2D w/bump). Each panel represents a snapshot at a) tΩ = 50, b)100; c)250; and d)500. Dust densities increase from black (zero density) to bright white (ρd = 2ρ0). Initially, the pressure bump concentrates the dust particles, with the dust-to-gas mass ratio being nearly unity (panel a)). Subsequent panels show the growth of SI in this dust-dense region. We note that the region near the pressure bump is zoomed-in and the whole computational domain is radially wider.
Current usage metrics show cumulative count of Article Views (full-text article views including HTML views, PDF and ePub downloads, according to the available data) and Abstracts Views on Vision4Press platform.
Data correspond to usage on the plateform after 2015. The current usage metrics is available 48-96 hours after online publication and is updated daily on week days.
Initial download of the metrics may take a while.