Fig. 1
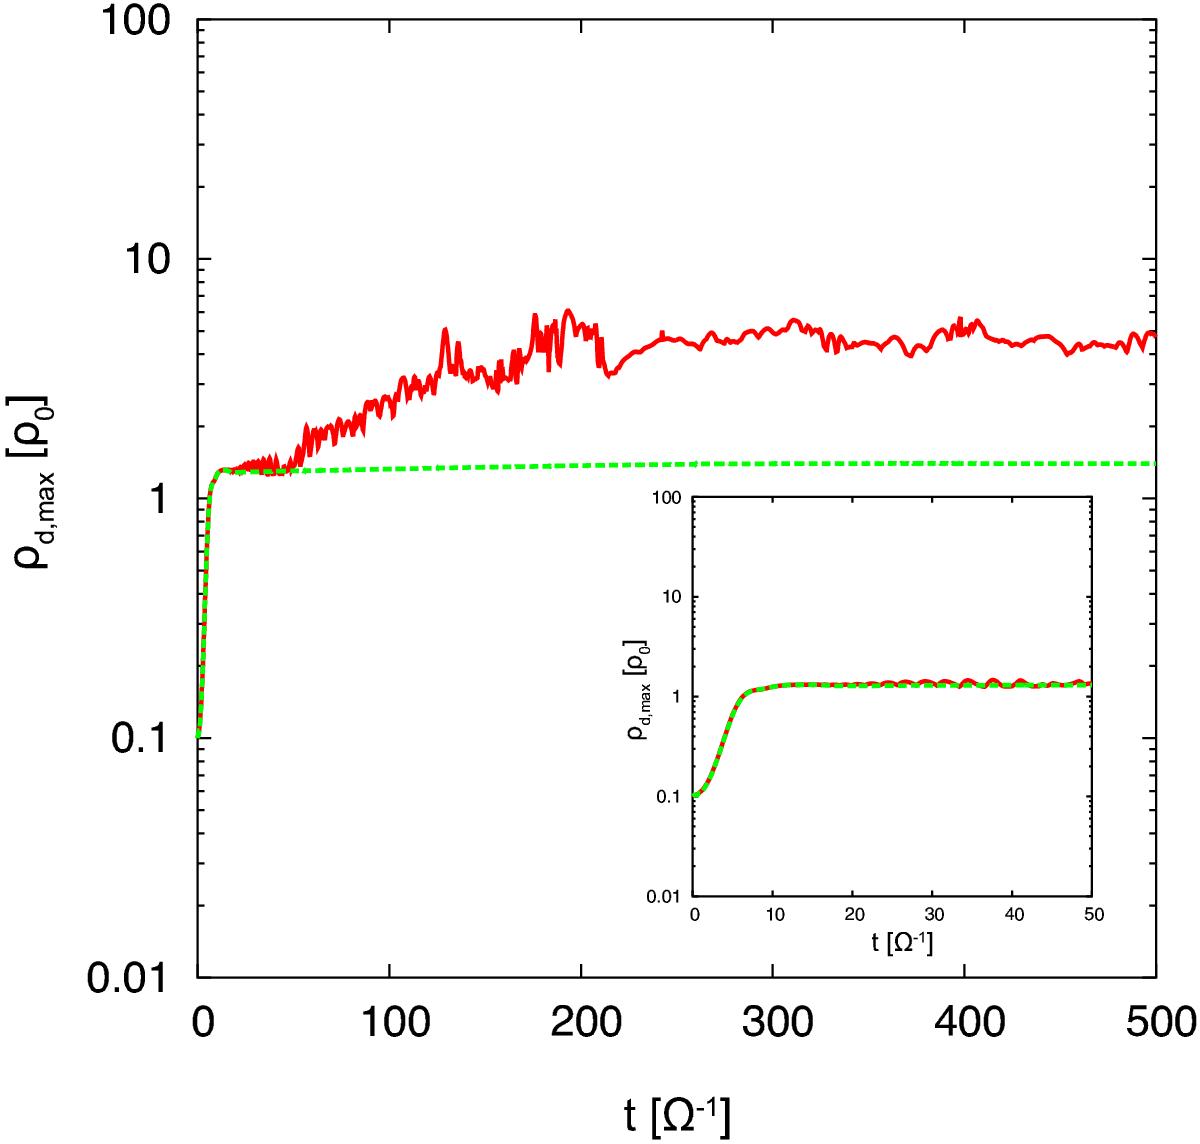
Time evolution of the highest dust density in run β04-2D (2D w/bump; red line) and β04-1D (1D w/bump; green dashed line). All the lines represent the dust density in the cell with the highest density of the whole computational region, normalized by the background gas density ρ0. The initial dust accumulation due to the bump structure is almost the same in the two runs (see inset).
Current usage metrics show cumulative count of Article Views (full-text article views including HTML views, PDF and ePub downloads, according to the available data) and Abstracts Views on Vision4Press platform.
Data correspond to usage on the plateform after 2015. The current usage metrics is available 48-96 hours after online publication and is updated daily on week days.
Initial download of the metrics may take a while.