Free Access
Fig. 2
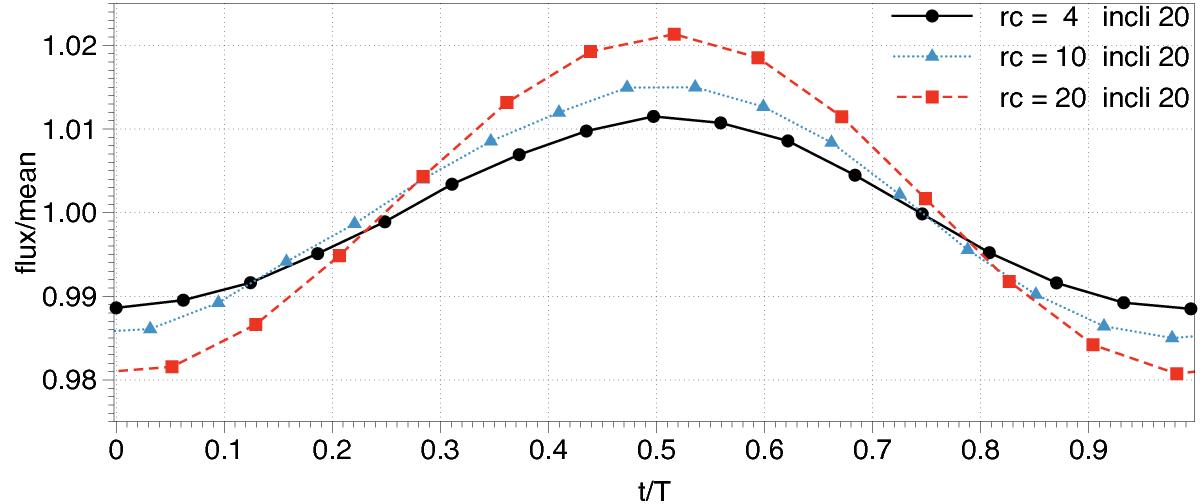
Renormalized light curves obtained for the same spiral with three values of the inner edge of the disk and associated corotation radii. Here the system is viewed at an inclination i = 20° and the black dots represent rc = 4rISCO, blue triangles rc = 10rISCO and red squares rc = 20rISCO.
Current usage metrics show cumulative count of Article Views (full-text article views including HTML views, PDF and ePub downloads, according to the available data) and Abstracts Views on Vision4Press platform.
Data correspond to usage on the plateform after 2015. The current usage metrics is available 48-96 hours after online publication and is updated daily on week days.
Initial download of the metrics may take a while.