Fig. 8
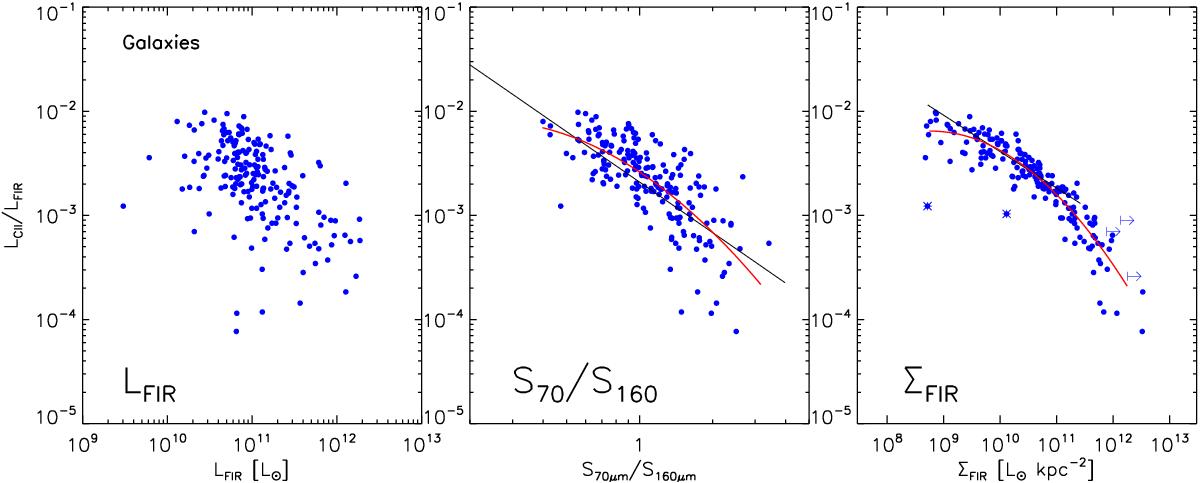
Ratio of [Cii] and FIR luminosity as a function of FIR luminosity (left), FIR color (middle) and FIR surface brightness (right panel). Red lines indicate the fits to our sample (Eqs. (12) and (13)), and black lines results of Díaz-Santos et al. (2013). The two slightly outlying points marked with an overlayed asterisk in the right panel were not used for the fit that is shown in red. Suitable [Cii] data are available for the 182 galaxies that are plotted here.
Current usage metrics show cumulative count of Article Views (full-text article views including HTML views, PDF and ePub downloads, according to the available data) and Abstracts Views on Vision4Press platform.
Data correspond to usage on the plateform after 2015. The current usage metrics is available 48-96 hours after online publication and is updated daily on week days.
Initial download of the metrics may take a while.