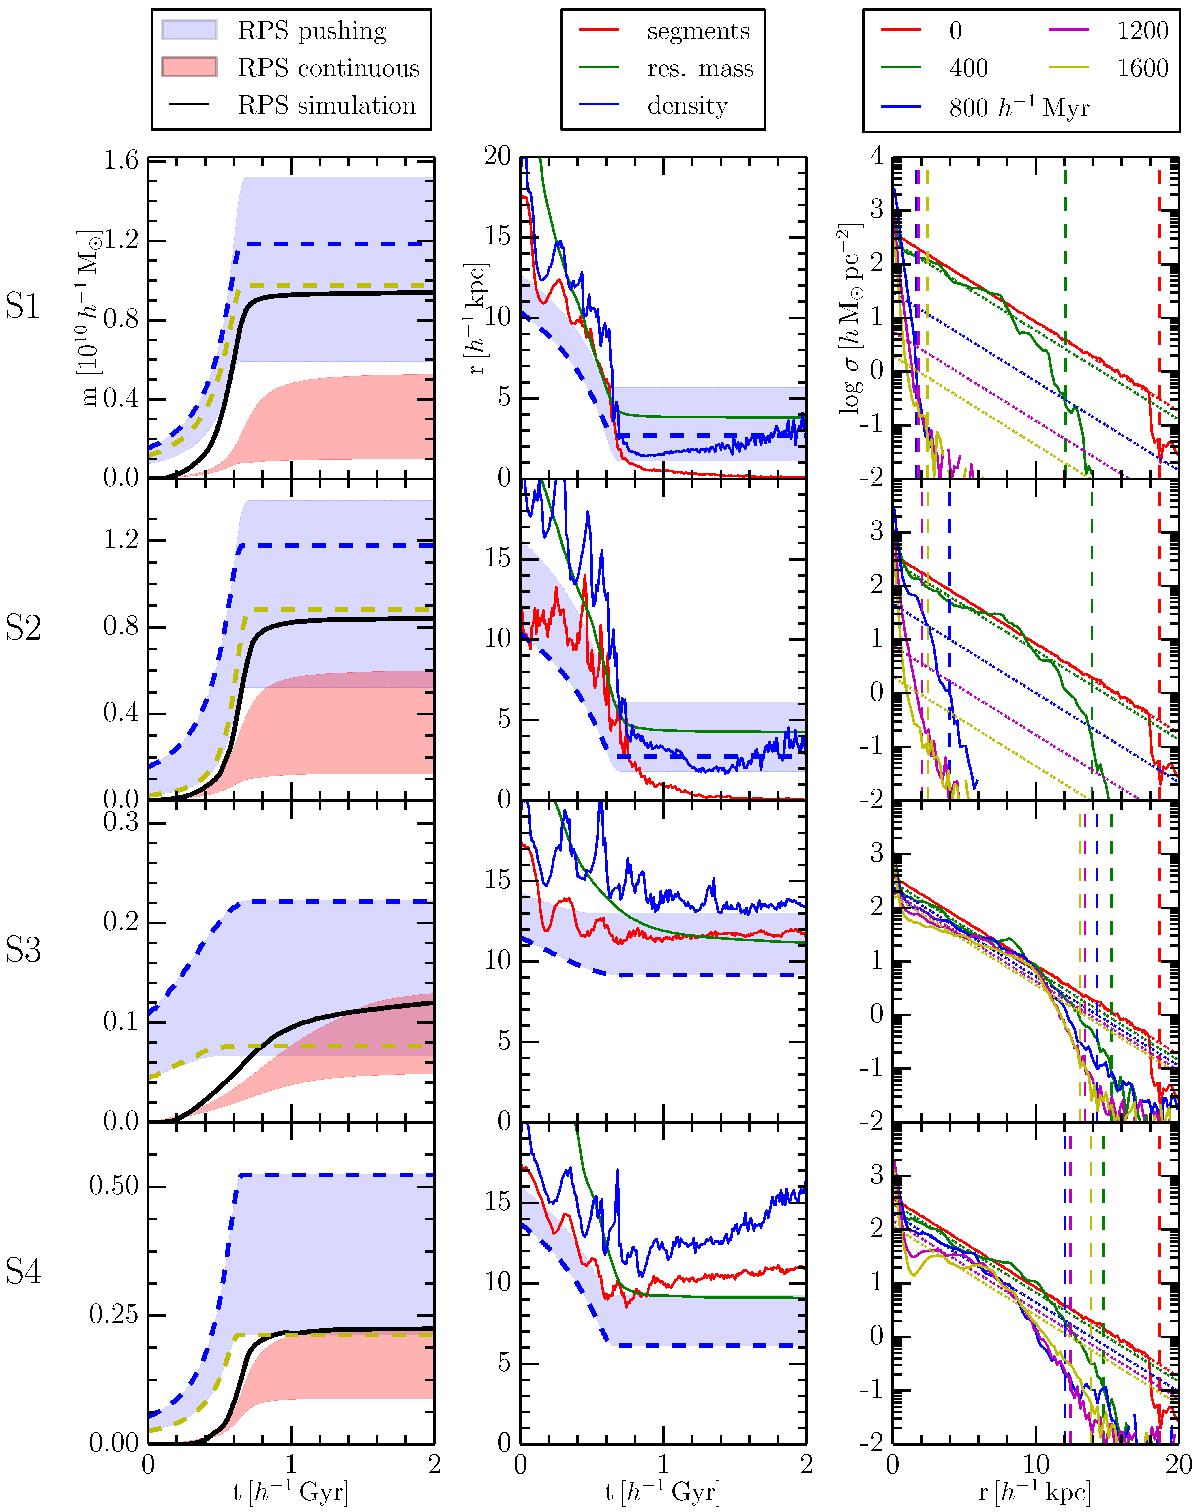
Fig. 5

Ram-pressure stripping of galaxy G1a for runs S1−S4 in the corresponding clusters. The panels of the column on the right-hand side show gas surface density profiles of the galaxy (solid lines) and exponential surface density fits based on the gas mass in the galaxy at a particular timestep (dotted lines) as coded by the colours. Vertical dashed lines indicate the radius, at which the actual surface density drops more than one dex below the exponential fit. The panels of the middle column give the evolution of the stripping radius in the simulations, which are determined with three different measurement methods (defined in Sect. 3.2). The blue shaded area encloses the minimum and maximum stripping radius, calculated by different theoretical predictions based on the standard Gunn & Gott (1972) criterion (blue dashed line), considering initial or current and total disk mass, the inclination of the galaxy as well as Rankine-Hugoniot post-shock conditions. The black lines in the panels of the left column show the effective mass lost via stripping in the simulations. The edges of the blue shaded region indicate the minimum and maximum mass loss, considering the stripping radius calculated with the different models. The red shaded area depicts the corresponding extrema of mass loss due to a continuous stripping assumption. The yellow dashed lines indicate the model that best fits the corresponding simulation.
Current usage metrics show cumulative count of Article Views (full-text article views including HTML views, PDF and ePub downloads, according to the available data) and Abstracts Views on Vision4Press platform.
Data correspond to usage on the plateform after 2015. The current usage metrics is available 48-96 hours after online publication and is updated daily on week days.
Initial download of the metrics may take a while.


