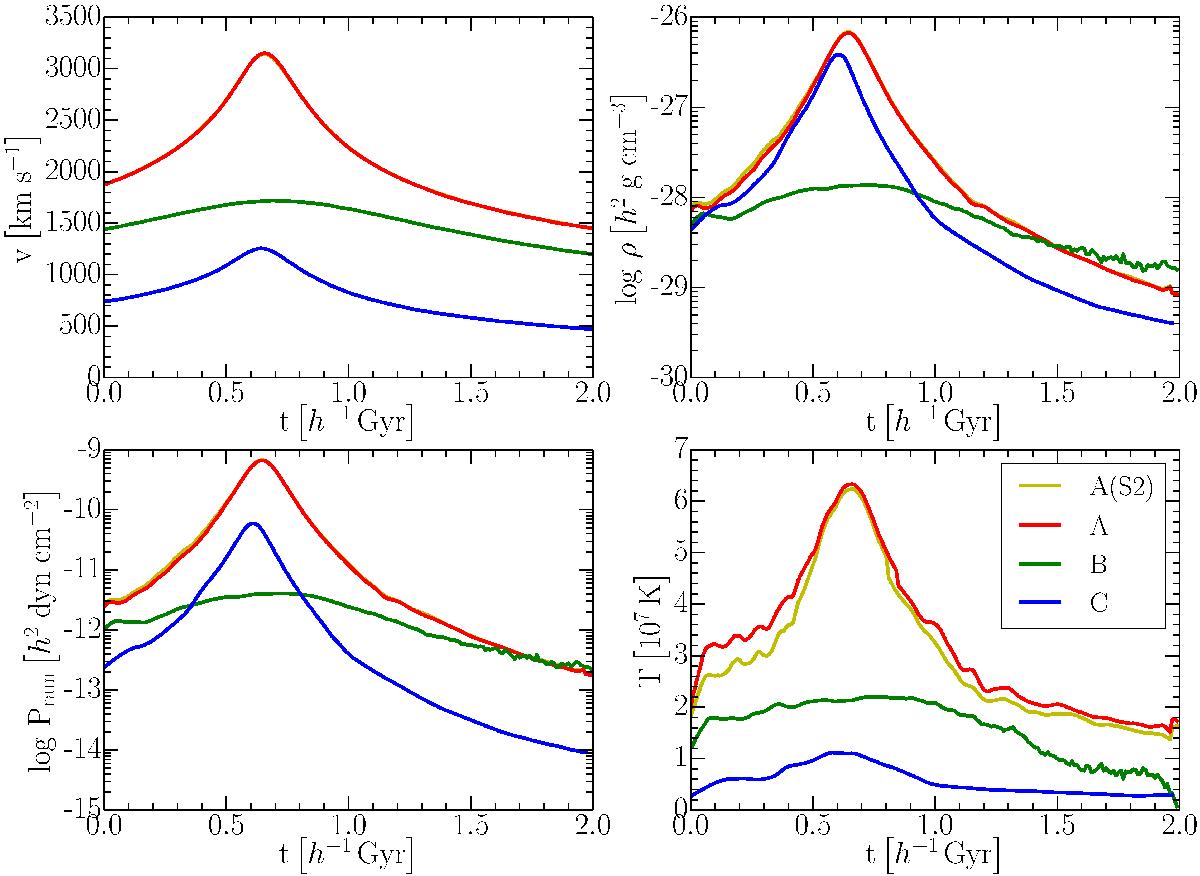
Fig. 3

Physical conditions encountered by galaxy G1 as it falls into different galaxy clusters. The top left panel shows the relative velocity of the galaxy, the top right panel shows the ICM density, the bottom left panel gives the resulting ram pressure Pram, and the bottom right panel indicates the ICM temperature encountered by galaxy G1a for runs S1, S3, and S4, respectively. Galaxy inclination does not affect these values significantly, hence run S2 looks essentially the same as S1 and is hence not shown. Also, as in Fig. 2, the values for galaxy G2 in runs S5−S7 are very similar as the trajectories are nearly the same.
Current usage metrics show cumulative count of Article Views (full-text article views including HTML views, PDF and ePub downloads, according to the available data) and Abstracts Views on Vision4Press platform.
Data correspond to usage on the plateform after 2015. The current usage metrics is available 48-96 hours after online publication and is updated daily on week days.
Initial download of the metrics may take a while.


