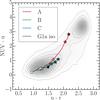
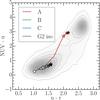
Fig. 11

Colour–colour diagrams showing the evolution of galaxies in NUV-u vs. u-r space as they interact with different clusters. The top panel is for model galaxy G1, and the bottom panel for G2. The colour is indicating different environments as shown in the legend. Stars mark simulation times with their brightness encoding 0, 0.5, 1.5 and 2 h-1 Gyr (the brightness corresponds to the one used for the big squares in Figs. 9a and b). The grey shaded contours represent the densities of the observed early- (upper right concentration) and late-type (lower left peak) galaxy populations, as determined by Schawinski et al. (2014).
Current usage metrics show cumulative count of Article Views (full-text article views including HTML views, PDF and ePub downloads, according to the available data) and Abstracts Views on Vision4Press platform.
Data correspond to usage on the plateform after 2015. The current usage metrics is available 48-96 hours after online publication and is updated daily on week days.
Initial download of the metrics may take a while.


