Fig. 9
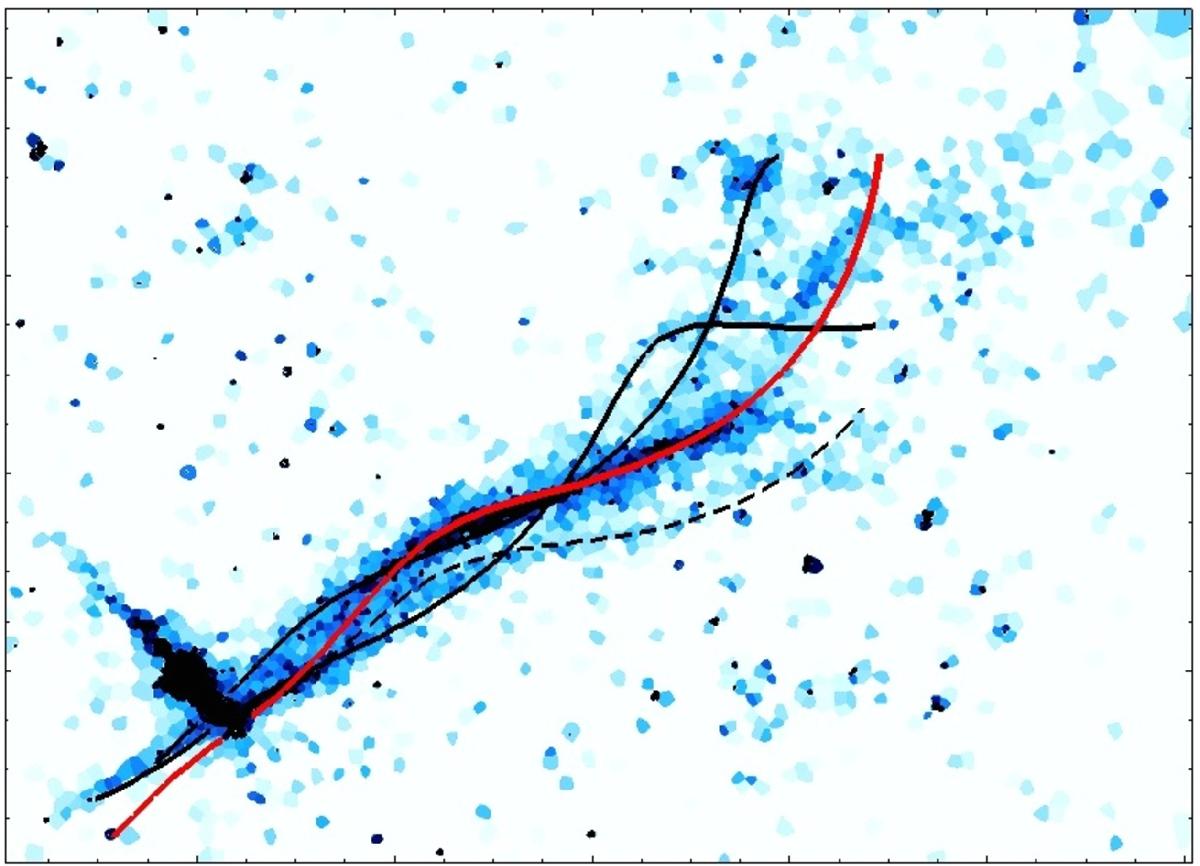
Solid red line: best fit to the main jet with a simple helical model, superimposed on the 250 ks Chandra mosaic with Voronoi adaptive binning (Fig. 2). The model is in relatively good agreement with the shape of the jet at distances >90′′ from the pulsar; however, it fails to reproduce the regions closer to the pulsar and the counter-jet. Solid black lines represent tentative additional helices, each with a different helical phase. An additional tentative helix with different viewing angle is drawn with a dashed line.
Current usage metrics show cumulative count of Article Views (full-text article views including HTML views, PDF and ePub downloads, according to the available data) and Abstracts Views on Vision4Press platform.
Data correspond to usage on the plateform after 2015. The current usage metrics is available 48-96 hours after online publication and is updated daily on week days.
Initial download of the metrics may take a while.