Fig. 7
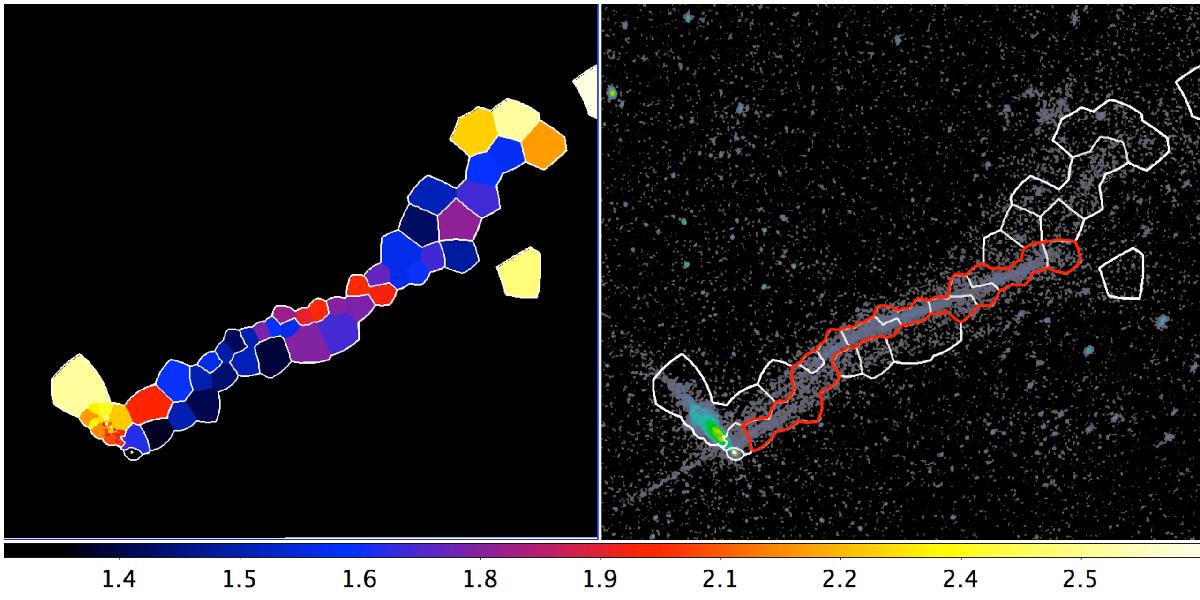
Left panel: photon index map along the main jet and PWN. The colours represent different spectral indices, as shown in the colourbar at the bottom of the plot. Contours are drawn around the regions for clarity at levels of Γ = 1.1,1.5,1.8,2.8. Typical uncertainties on the spectral indices are of the order of ± 0.1. Right panel: the same contours are reported on the spatial map to aid the visual identification of the regions used for the spectral extractions and of the regions clustering around similar values of Γ. The region in red was used to extract spectra from the main jet.
Current usage metrics show cumulative count of Article Views (full-text article views including HTML views, PDF and ePub downloads, according to the available data) and Abstracts Views on Vision4Press platform.
Data correspond to usage on the plateform after 2015. The current usage metrics is available 48-96 hours after online publication and is updated daily on week days.
Initial download of the metrics may take a while.