Fig. 4
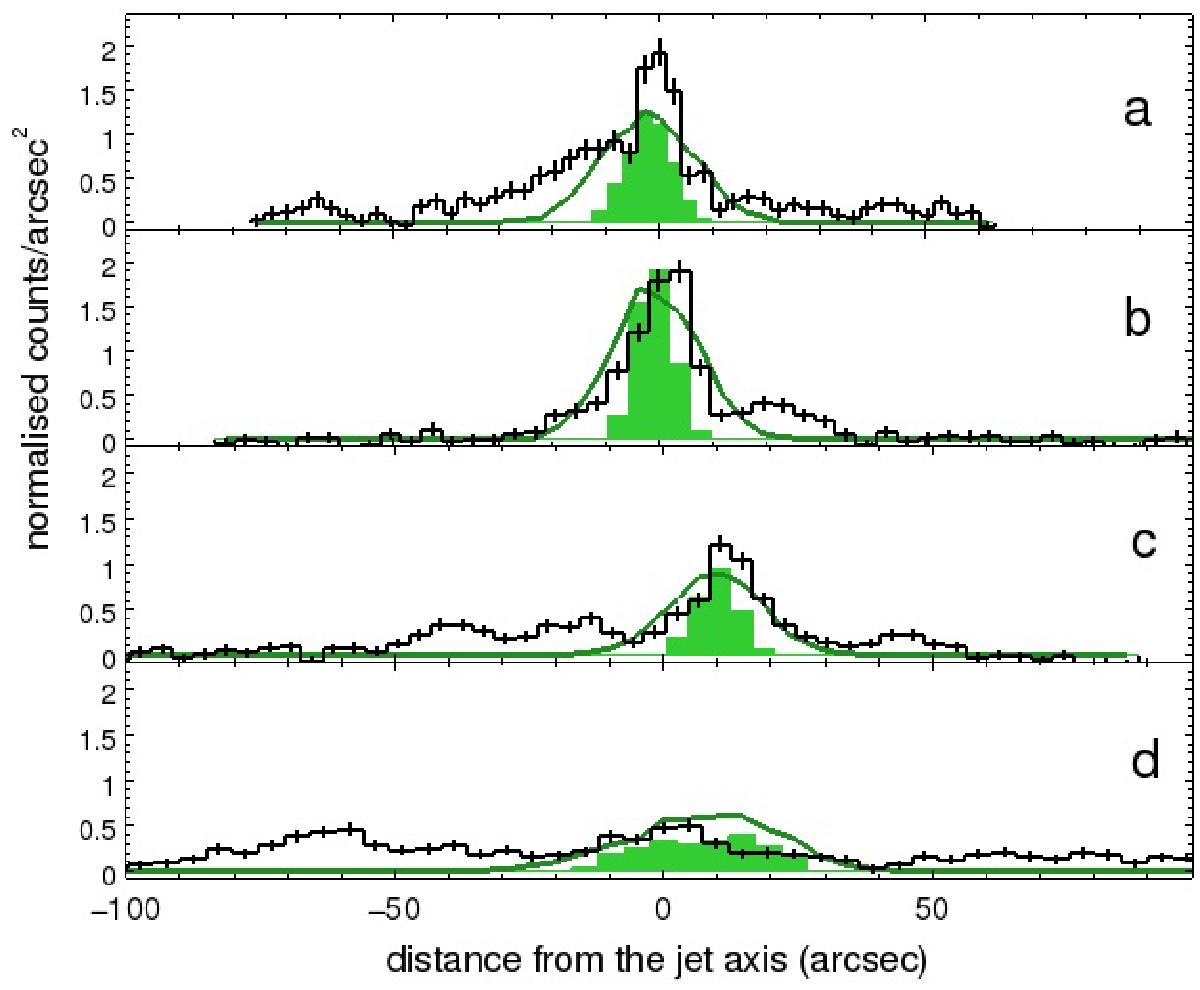
Surface brightness profiles (black histograms) extracted in four cuts perpendicular to the main jet (see regions a–d in Fig. 1). For comparison we also plot the corresponding profiles obtained from a model with a single narrow (green histogram) or large (green solid curve) helical jet (see Sect. 2.5). In each plot the distance from the jet axis increases towards the pulsar direction of motion (SW).
Current usage metrics show cumulative count of Article Views (full-text article views including HTML views, PDF and ePub downloads, according to the available data) and Abstracts Views on Vision4Press platform.
Data correspond to usage on the plateform after 2015. The current usage metrics is available 48-96 hours after online publication and is updated daily on week days.
Initial download of the metrics may take a while.