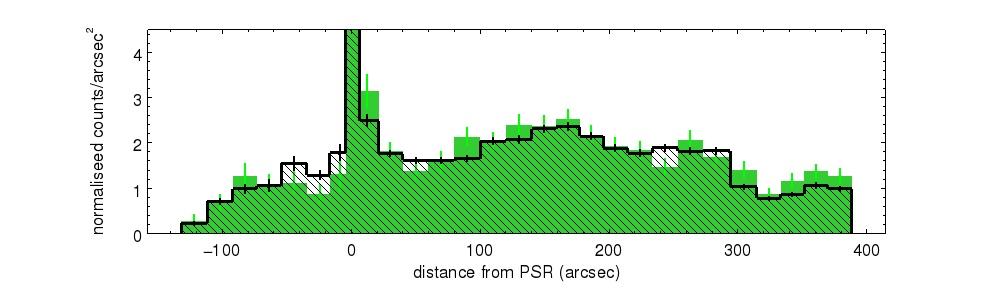
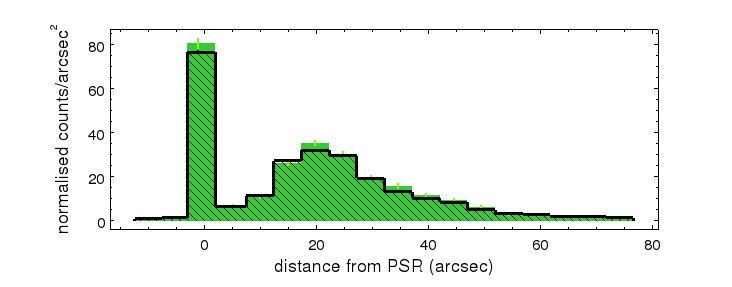
Fig. 3
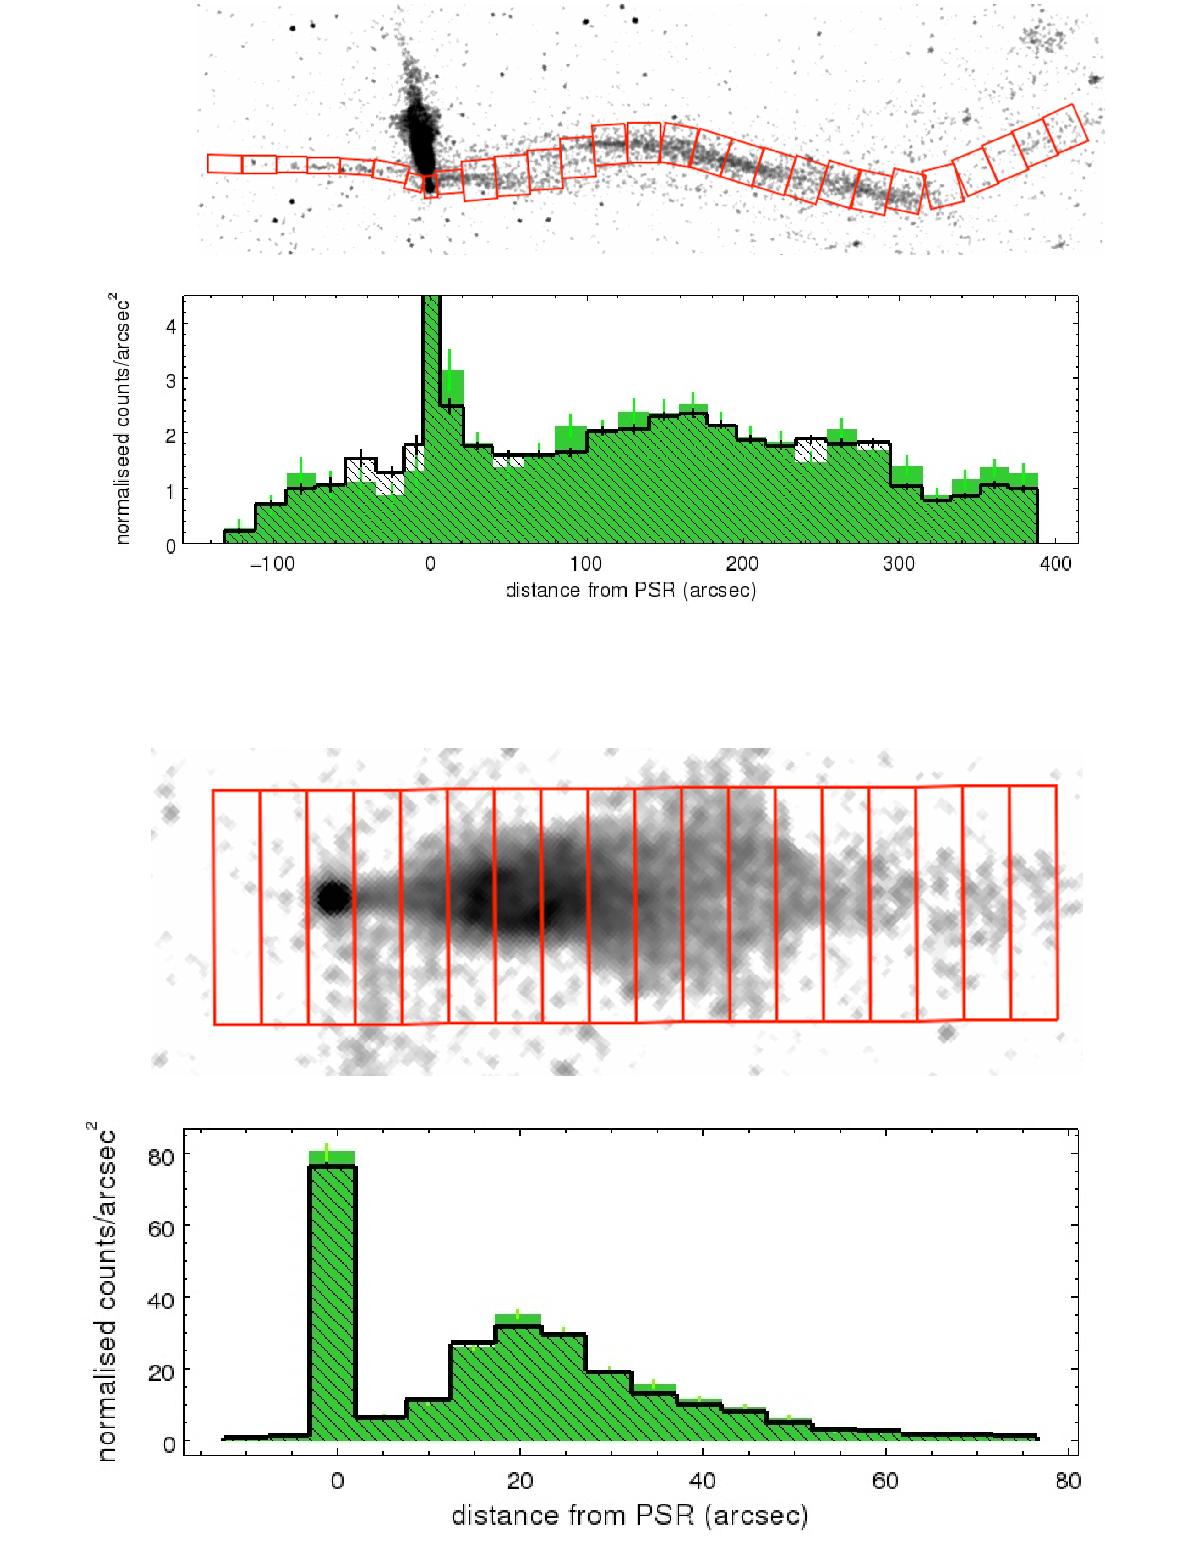
Top panels: brightness profile as a function of distance from the pulsar, extracted along the jets, from the regions shown in the image above (the brightness in the pulsar bin is not to scale). The horizontal scale is the same in the profile plot and in the extraction region image. The black profile is computed from the new 250 ks data; for comparison the profile obtained from the previous 50 ks observation is represented with a filled green histogram. Bottom panels: same as above, but for the extraction regions along the PWN.
Current usage metrics show cumulative count of Article Views (full-text article views including HTML views, PDF and ePub downloads, according to the available data) and Abstracts Views on Vision4Press platform.
Data correspond to usage on the plateform after 2015. The current usage metrics is available 48-96 hours after online publication and is updated daily on week days.
Initial download of the metrics may take a while.