Free Access
Fig. 11
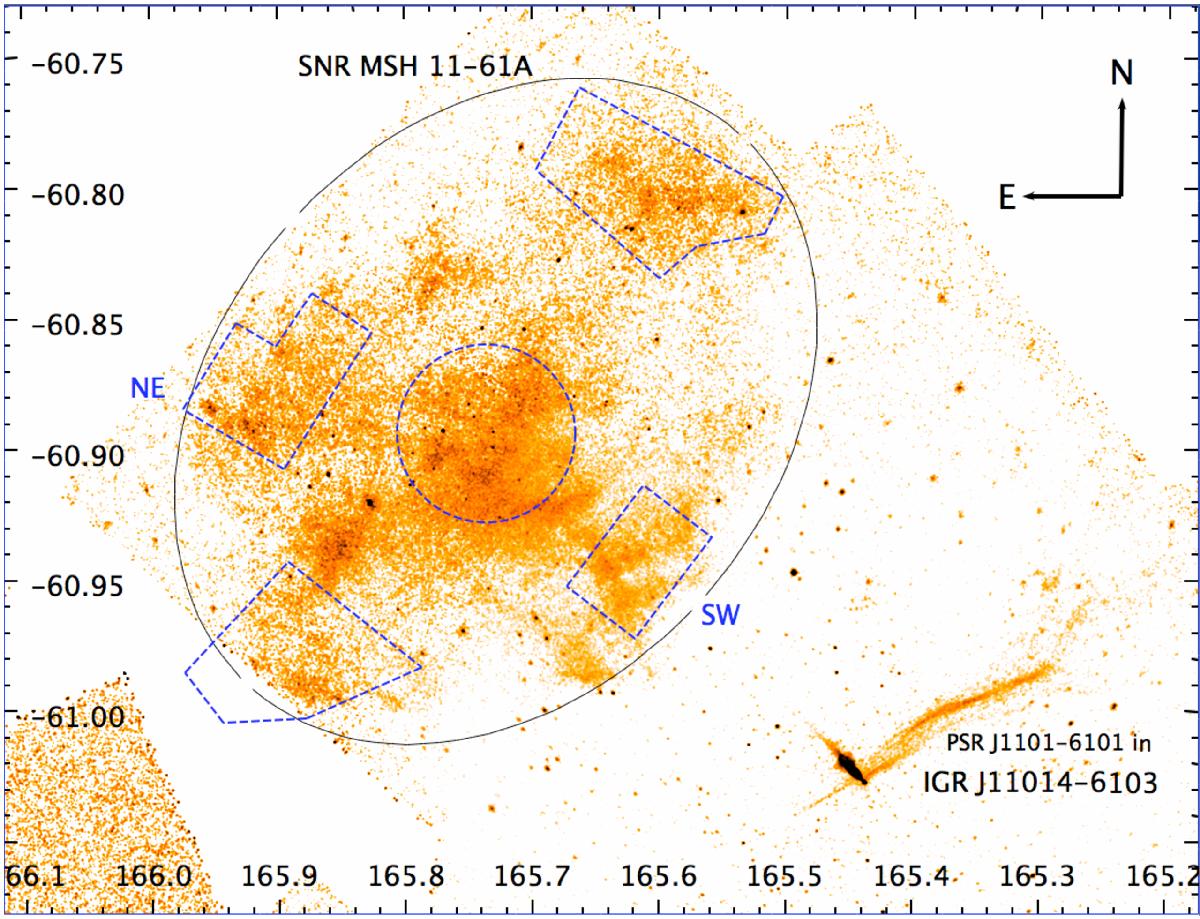
Mosaic including all archival Chandra observations of the SNR MSH 11-61A and IGR J11014-6103 region. The dashed blue polygons are a reproduction of the extraction regions used by García et al. (2012) for the spectral analysis of the SNR (see discussion in Sect. 4).
Current usage metrics show cumulative count of Article Views (full-text article views including HTML views, PDF and ePub downloads, according to the available data) and Abstracts Views on Vision4Press platform.
Data correspond to usage on the plateform after 2015. The current usage metrics is available 48-96 hours after online publication and is updated daily on week days.
Initial download of the metrics may take a while.