Fig. 1
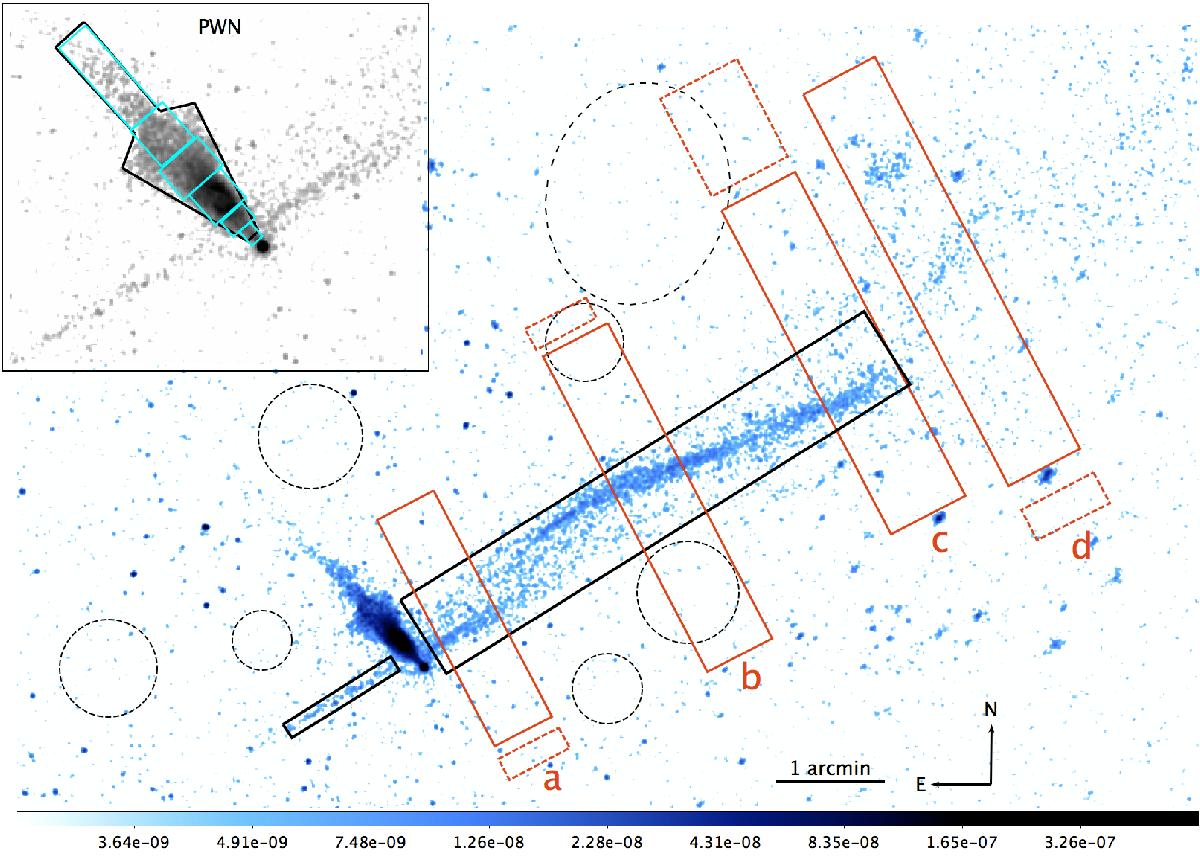
Chandra 250 ks mosaic of the Lighthouse Nebula (exposure corrected and smoothed with a Gaussian kernel of σ = 1.5 pixel). The colour scale at the bottom of the plot is in units of photon/cm2/s. Solid red rectangles a–d (and the corresponding dashed background boxes) indicate the regions used to extract brightness profiles perpendicularly to the main jet (Sect. 2.3). The regions used for spectral extraction are also shown: the average spectra of the main jet, the counter-jet, and the PWN were extracted from the solid black regions (Sect. 2.4.1). For the point source PSR J1101-6101 we used a circle of radius 1.6′′ centred on the pulsar position (not shown). Background regions are marked with dashed black circles. In the inset: the details of the PWN shape and the attaching points of the two jets to the pulsar are visible. Coloured rectangles along the PWN indicate the regions used to extract spatially resolved spectra (Sect. 2.4.2). In this image, as in the rest of the paper, north is up and east is to the left.
Current usage metrics show cumulative count of Article Views (full-text article views including HTML views, PDF and ePub downloads, according to the available data) and Abstracts Views on Vision4Press platform.
Data correspond to usage on the plateform after 2015. The current usage metrics is available 48-96 hours after online publication and is updated daily on week days.
Initial download of the metrics may take a while.