Fig. 6
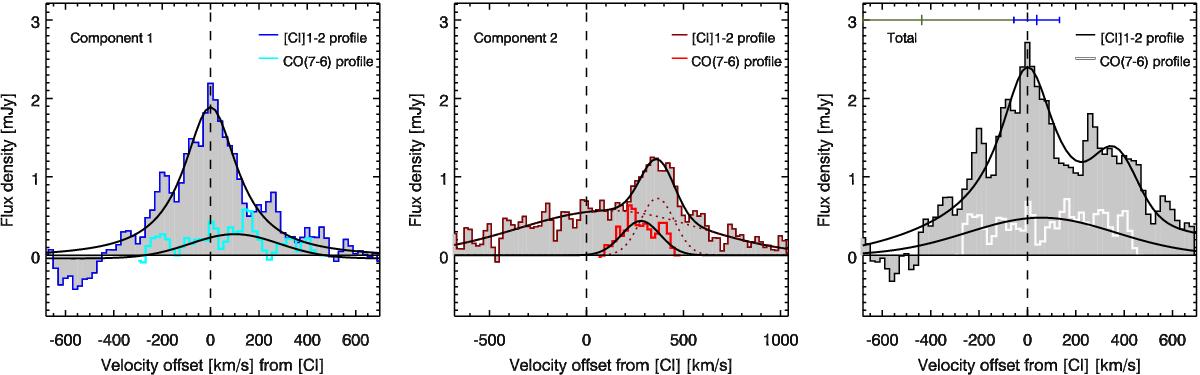
[CI]2–1 spectra (dark blue, dark red and black histograms) for component 1, component 2, and the total over-plotted with the respective CO(7–6) lines (light blue, orange and white histograms) to compare the velocity profiles. The fitted profiles from Sect. 3 are over-plotted as black curves, with the individual velocity components as dotted lines. The narrow [CI]2–1 component of component 2 is offset by 365 km s-1 from the systemic redshift. The bar above the velocity profiles in the right plot, marked the HeII redshift and errors (olive bar) from Röttgering et al. (1997) and the CO(1–0) redshift and error (blue bar) from Emonts et al. (2013).
Current usage metrics show cumulative count of Article Views (full-text article views including HTML views, PDF and ePub downloads, according to the available data) and Abstracts Views on Vision4Press platform.
Data correspond to usage on the plateform after 2015. The current usage metrics is available 48-96 hours after online publication and is updated daily on week days.
Initial download of the metrics may take a while.