Fig. 5
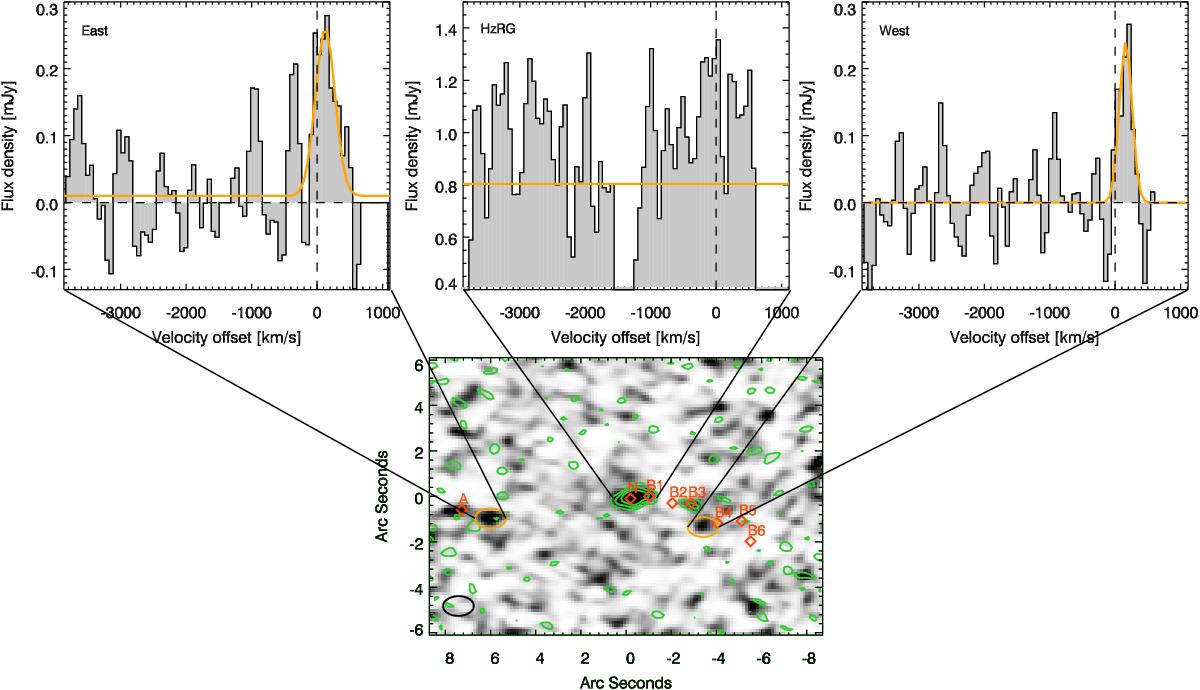
Non-continuum subtracted H2O spectra for the detection of the west and east and the non-detection at the position at the HzRG and H2O moment-0 map. Top left panel: H2O line detected ~50 kpc to the east of the radio core, has a 3.7σ significance. The emission is located due west of the knot A in the radio jet. The fitted Gaussian is over-plotted in orange. Top middle panel: spectrum at the position of the radio core, shows no detection of H2O emission – only continuum emission. A small separation between the two spectral windows results in the gap in the continuum between − 1300 and − 1500 km s-1. Top right panel: H2O line detected ~25 kpc to the west of the radio core, showing a 4σ H2O detection at the expected frequency for z = 2.161. The emission is located at the bend of the radio jet, B4 (Pentericci et al. 1997). The best-fit Gaussian is over-plotted in orange. Bottom panel: moment-0 map of the H2O emission (without continuum subtraction), overlaid with the 246 GHz continuum emission in green contours. The orange ellipses show the H2O emission and the orange-red diamonds the positions of the knots in the radio jet, given by Pentericci et al. (1997).
Current usage metrics show cumulative count of Article Views (full-text article views including HTML views, PDF and ePub downloads, according to the available data) and Abstracts Views on Vision4Press platform.
Data correspond to usage on the plateform after 2015. The current usage metrics is available 48-96 hours after online publication and is updated daily on week days.
Initial download of the metrics may take a while.