Fig. 4
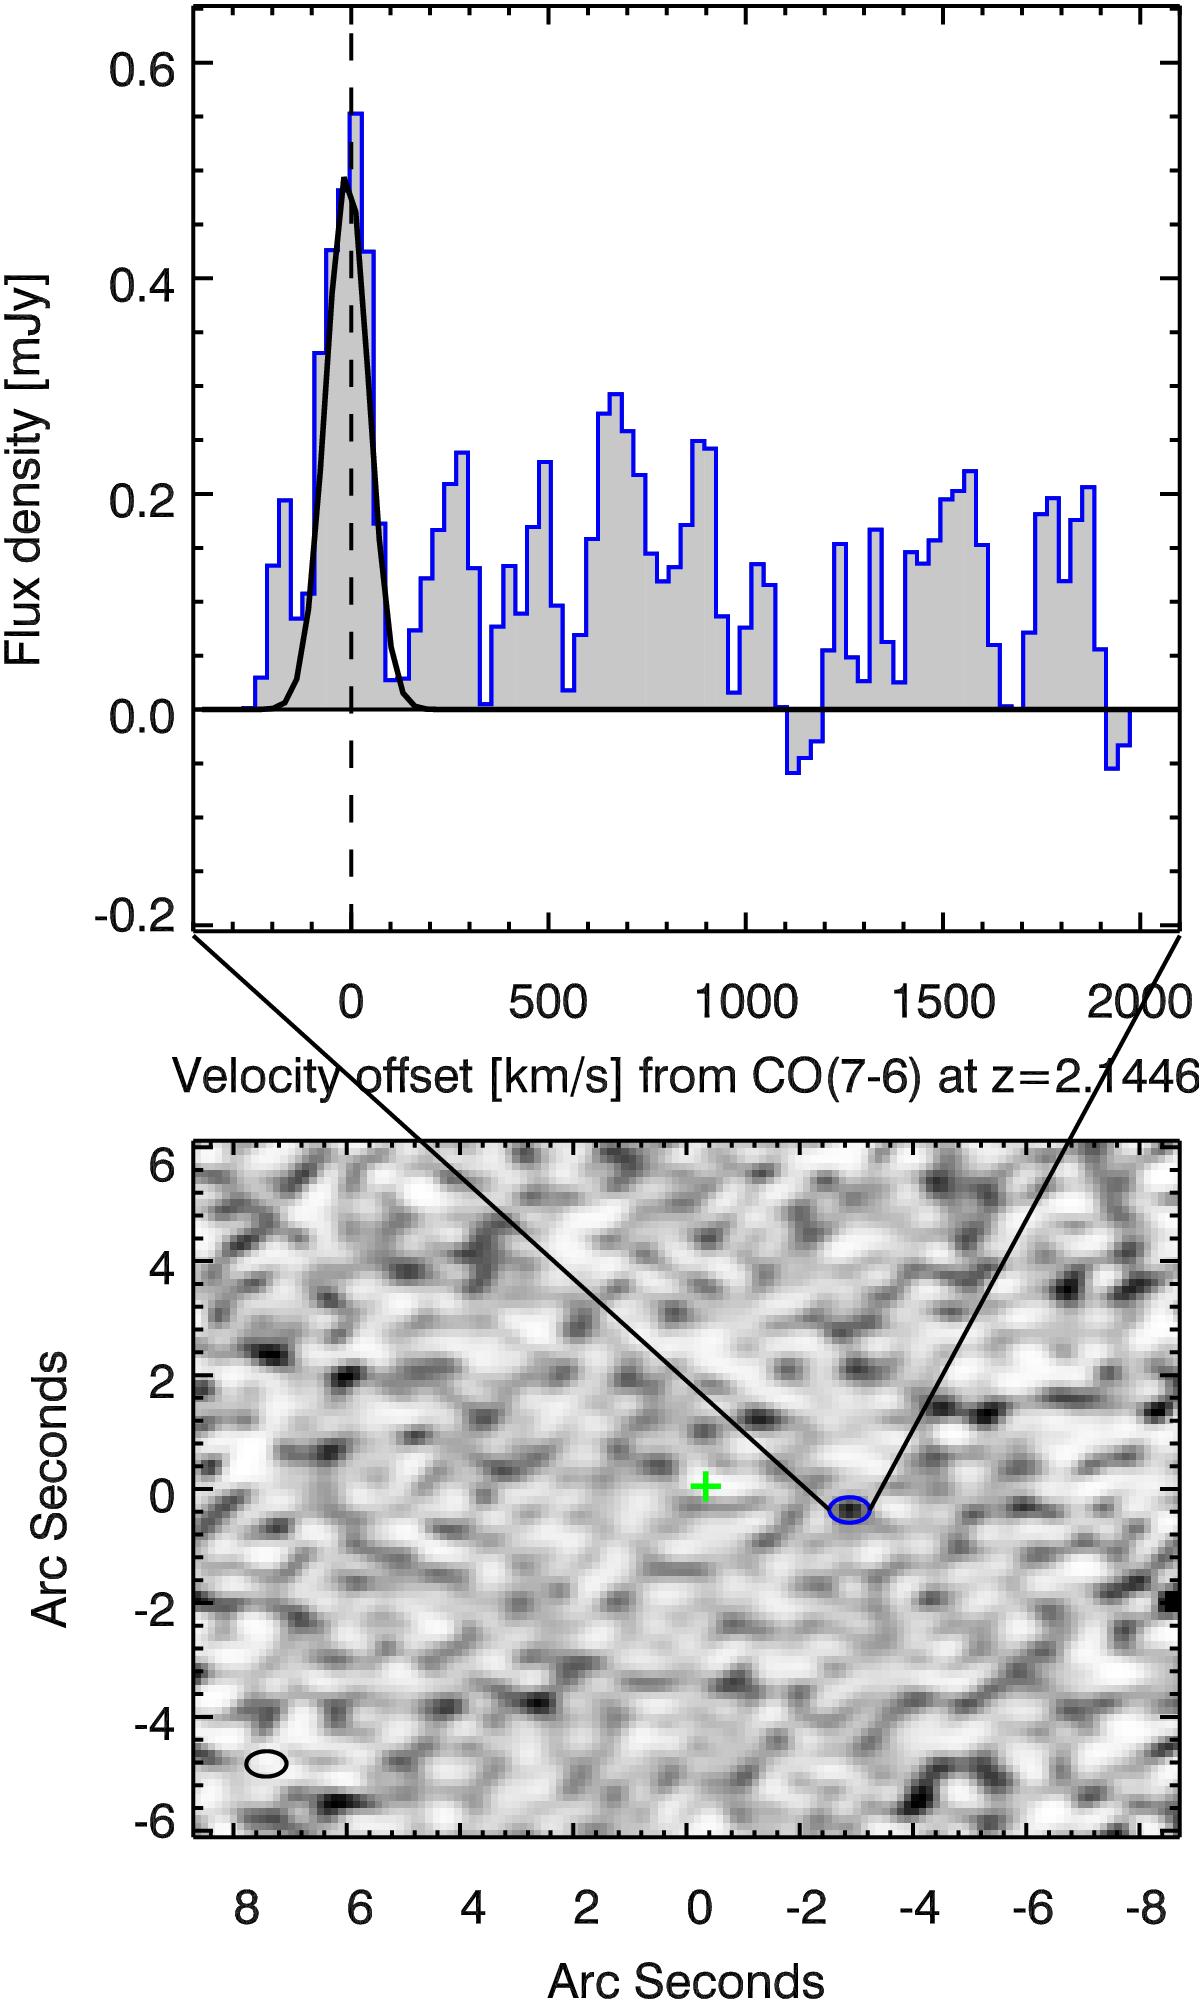
Bottom panel: moment-0 map of the CO(7–6) emission at the position of the brightest companion. Top panel: spectrum extracted from the beam-size area shown by the blue ellipse at the position of the companion sources in the bottom panel and is binned to 30 km s-1 channels. The spectrum shows both the continuum and CO(7–6) line emission. The redshift of the line is consistent with the optical z = 2.1446 (Kuiper et al. 2011), which was taken as zero velocity in the spectrum.
Current usage metrics show cumulative count of Article Views (full-text article views including HTML views, PDF and ePub downloads, according to the available data) and Abstracts Views on Vision4Press platform.
Data correspond to usage on the plateform after 2015. The current usage metrics is available 48-96 hours after online publication and is updated daily on week days.
Initial download of the metrics may take a while.