Fig. 3
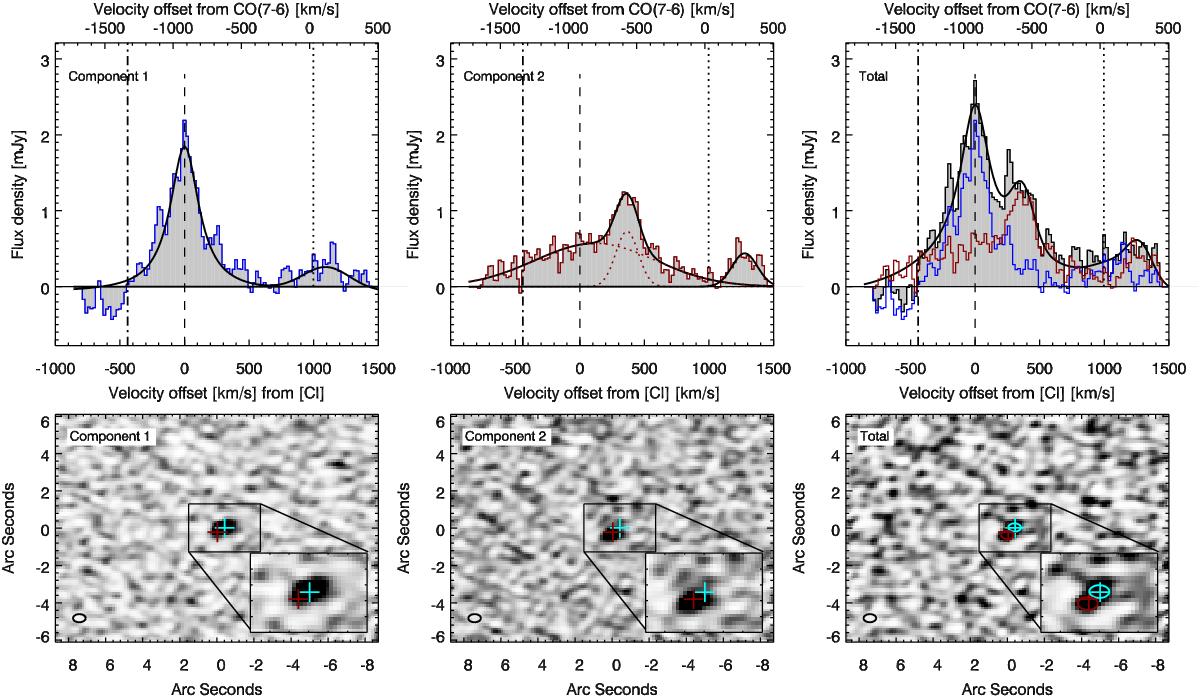
[CI]2–1 spectra and moment-0 maps for component 1, component 2, and the total [CI]2–1 and CO(7–6) emission. Top row: the spectra extracted from beam-sized areas for component 1, component 2, and the total. The areas from which the spectra of component 1 and component 2 are extracted do not overlap. The Lorentzian profile for the component 1 [CI]2–1 line (top left), the double Gaussian profile for the component 2 [CI]2–1 line (top middle), and the single Gaussian fits for the two CO(7–6) lines are over-plotted as black curves. The sum of the Lorentzian and Gaussian profiles is over-plotted in black in the total spectrum (top right). The dashed lines indicate the 0-velocity of the [CI]2–1 frequency at z = 2.1606, and the dotted lines indicate the 0-velocity for the CO(7–6) frequency at the same redshift. This redshift is in agreement with the redshift determined from the CO(1–0) line (Emonts et al. 2013). The dotted-dashed line indicate the 0-velocity of the [CI]2–1 frequency at z = 2.156, determined from the HeII λ1640Å line (which, as a non-resonant line, should represent the systemic velocity of the AGN, Humphrey et al. 2008). Bottom row: the moment-0 maps of the [CI]2–1 emission from component 1 (bottom left), component 2 (bottom middle), and the total (bottom right) [CI]2–1 emission and zoom-ins of the centres of the images. The total [CI]2–1 moment-0 maps is overlaid with [CI]2–1 line contours of component 1and 2. The blue and red crosses indicate the peaks of the [CI]2–1 emission of component 1 (blue) and component 2 (red).
Current usage metrics show cumulative count of Article Views (full-text article views including HTML views, PDF and ePub downloads, according to the available data) and Abstracts Views on Vision4Press platform.
Data correspond to usage on the plateform after 2015. The current usage metrics is available 48-96 hours after online publication and is updated daily on week days.
Initial download of the metrics may take a while.