Fig. 1
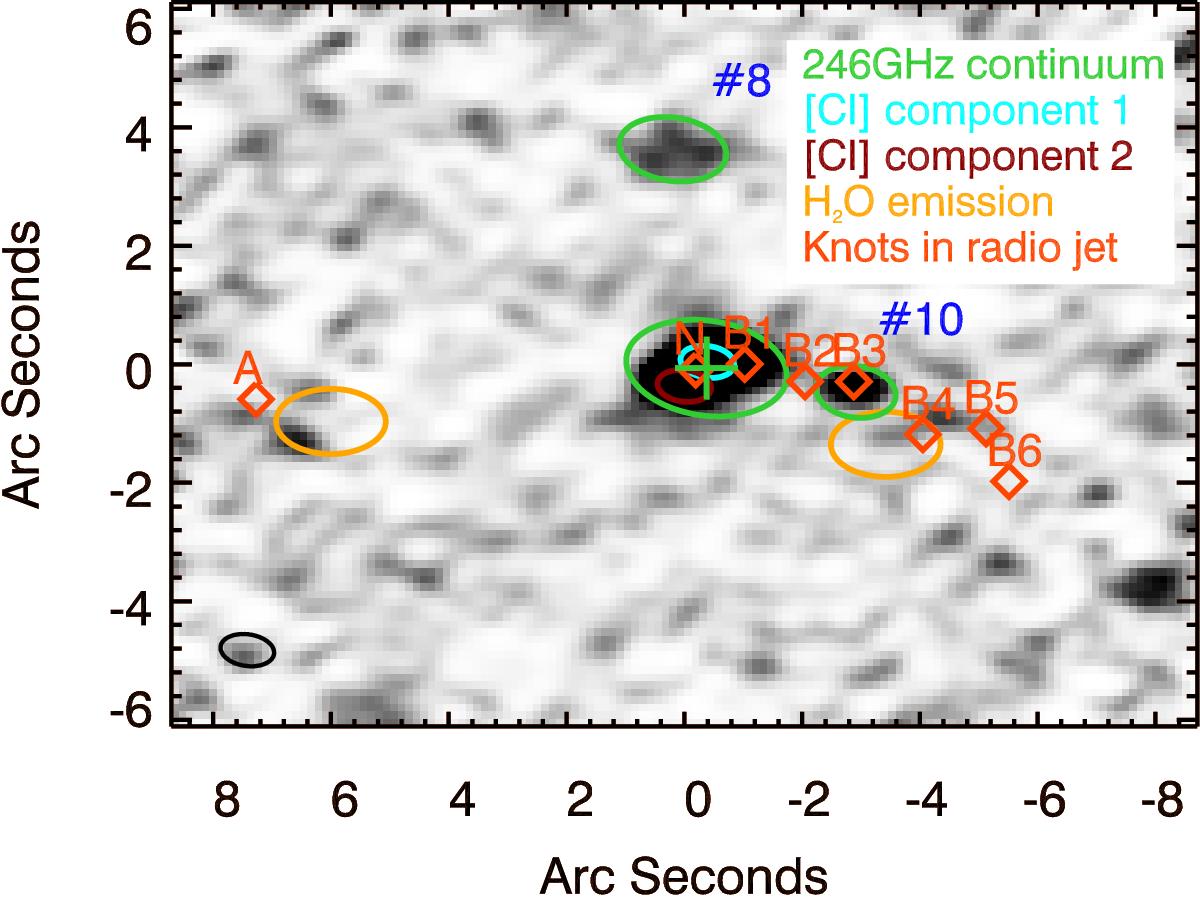
Overview of the spatial distribution of the detected components. The naturally weighted 246 GHz continuum map is in greyscale and the two [CI]2–1 components, 1 and 2, are shown with blue and red ellipses, respectively. The two H2O detections are shown with orange ellipses, and the 246 GHz continuum components shown with green ellipses. The sizes of the ellipses represent the extractions used for the photometry. The knots in the radio jet are indicated with red-orange diamonds and labeled according to Pentericci et al. (1997). The numbers correspond to the numbering in Kuiper et al. (2011). The ALMA beam is shown as a black ellipse in the lower left corner.
Current usage metrics show cumulative count of Article Views (full-text article views including HTML views, PDF and ePub downloads, according to the available data) and Abstracts Views on Vision4Press platform.
Data correspond to usage on the plateform after 2015. The current usage metrics is available 48-96 hours after online publication and is updated daily on week days.
Initial download of the metrics may take a while.