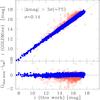
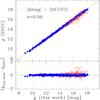
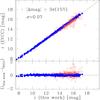
Fig. 4
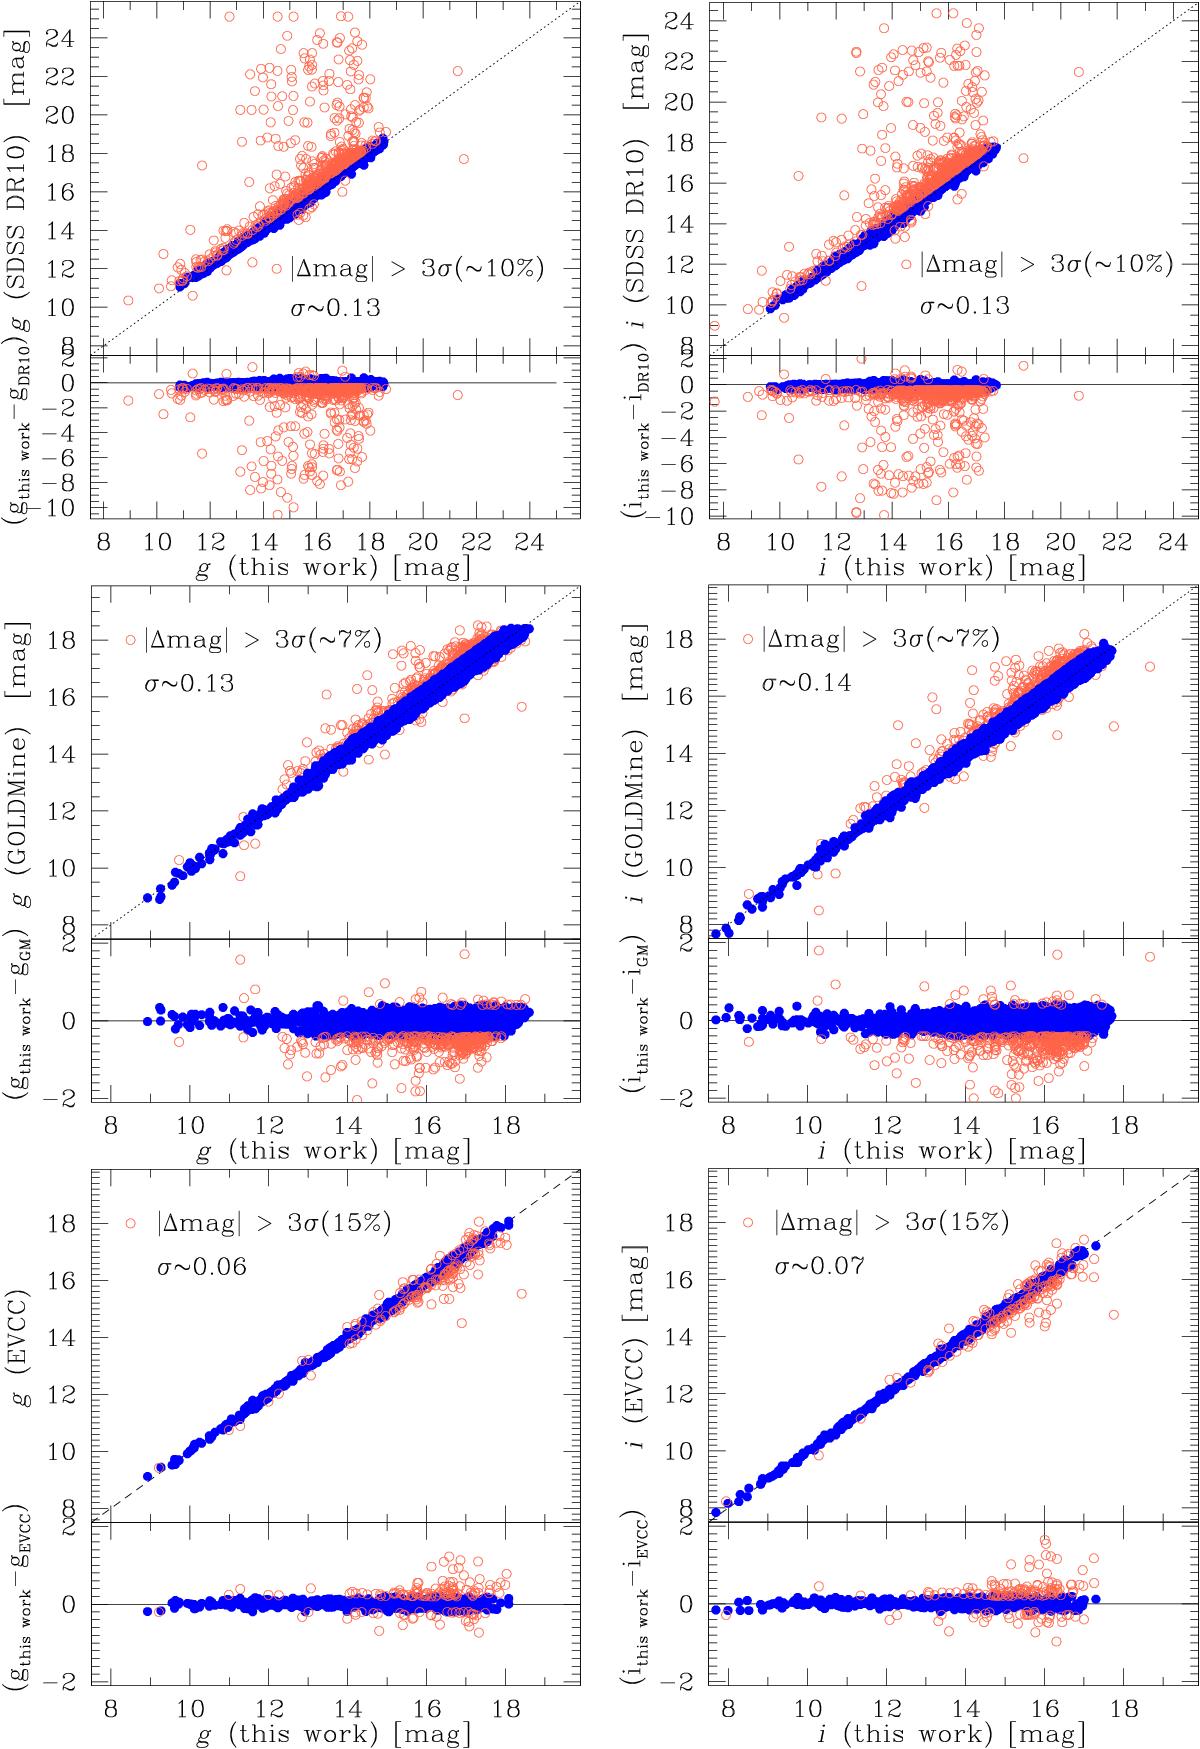
The g-band and i-band Petrosian magnitudes from this work compared to: magnitudes from the SDSS Data Release 10 (Ahn et al. 2014, top panels), those published in Gavazzi et al. (2012, 2013, middle panels), and from the Extended Virgo Cluster Catalog (Kim et al. 2014, bottom panels). Blue points refer to the data within 3σ from the one to one correlation, while the orange points highlight the outliers i.e., galaxies with Δmag > 3σ to the one-to-one relation (where sigma is the standard deviation of the residual distribution). In each panel we report the sigma of the residual distribution as well as the percentage of outliers. We stress that the agreement with Gavazzi et al. (2012, 2013b), Kim et al. (2014) is satisfactory, in particular for the brightest objects (42), that are totally missing in the SDSS DR10. For each plot, the bottom panel reports the residual magnitudes between the two measurements.
Current usage metrics show cumulative count of Article Views (full-text article views including HTML views, PDF and ePub downloads, according to the available data) and Abstracts Views on Vision4Press platform.
Data correspond to usage on the plateform after 2015. The current usage metrics is available 48-96 hours after online publication and is updated daily on week days.
Initial download of the metrics may take a while.