Fig. 12
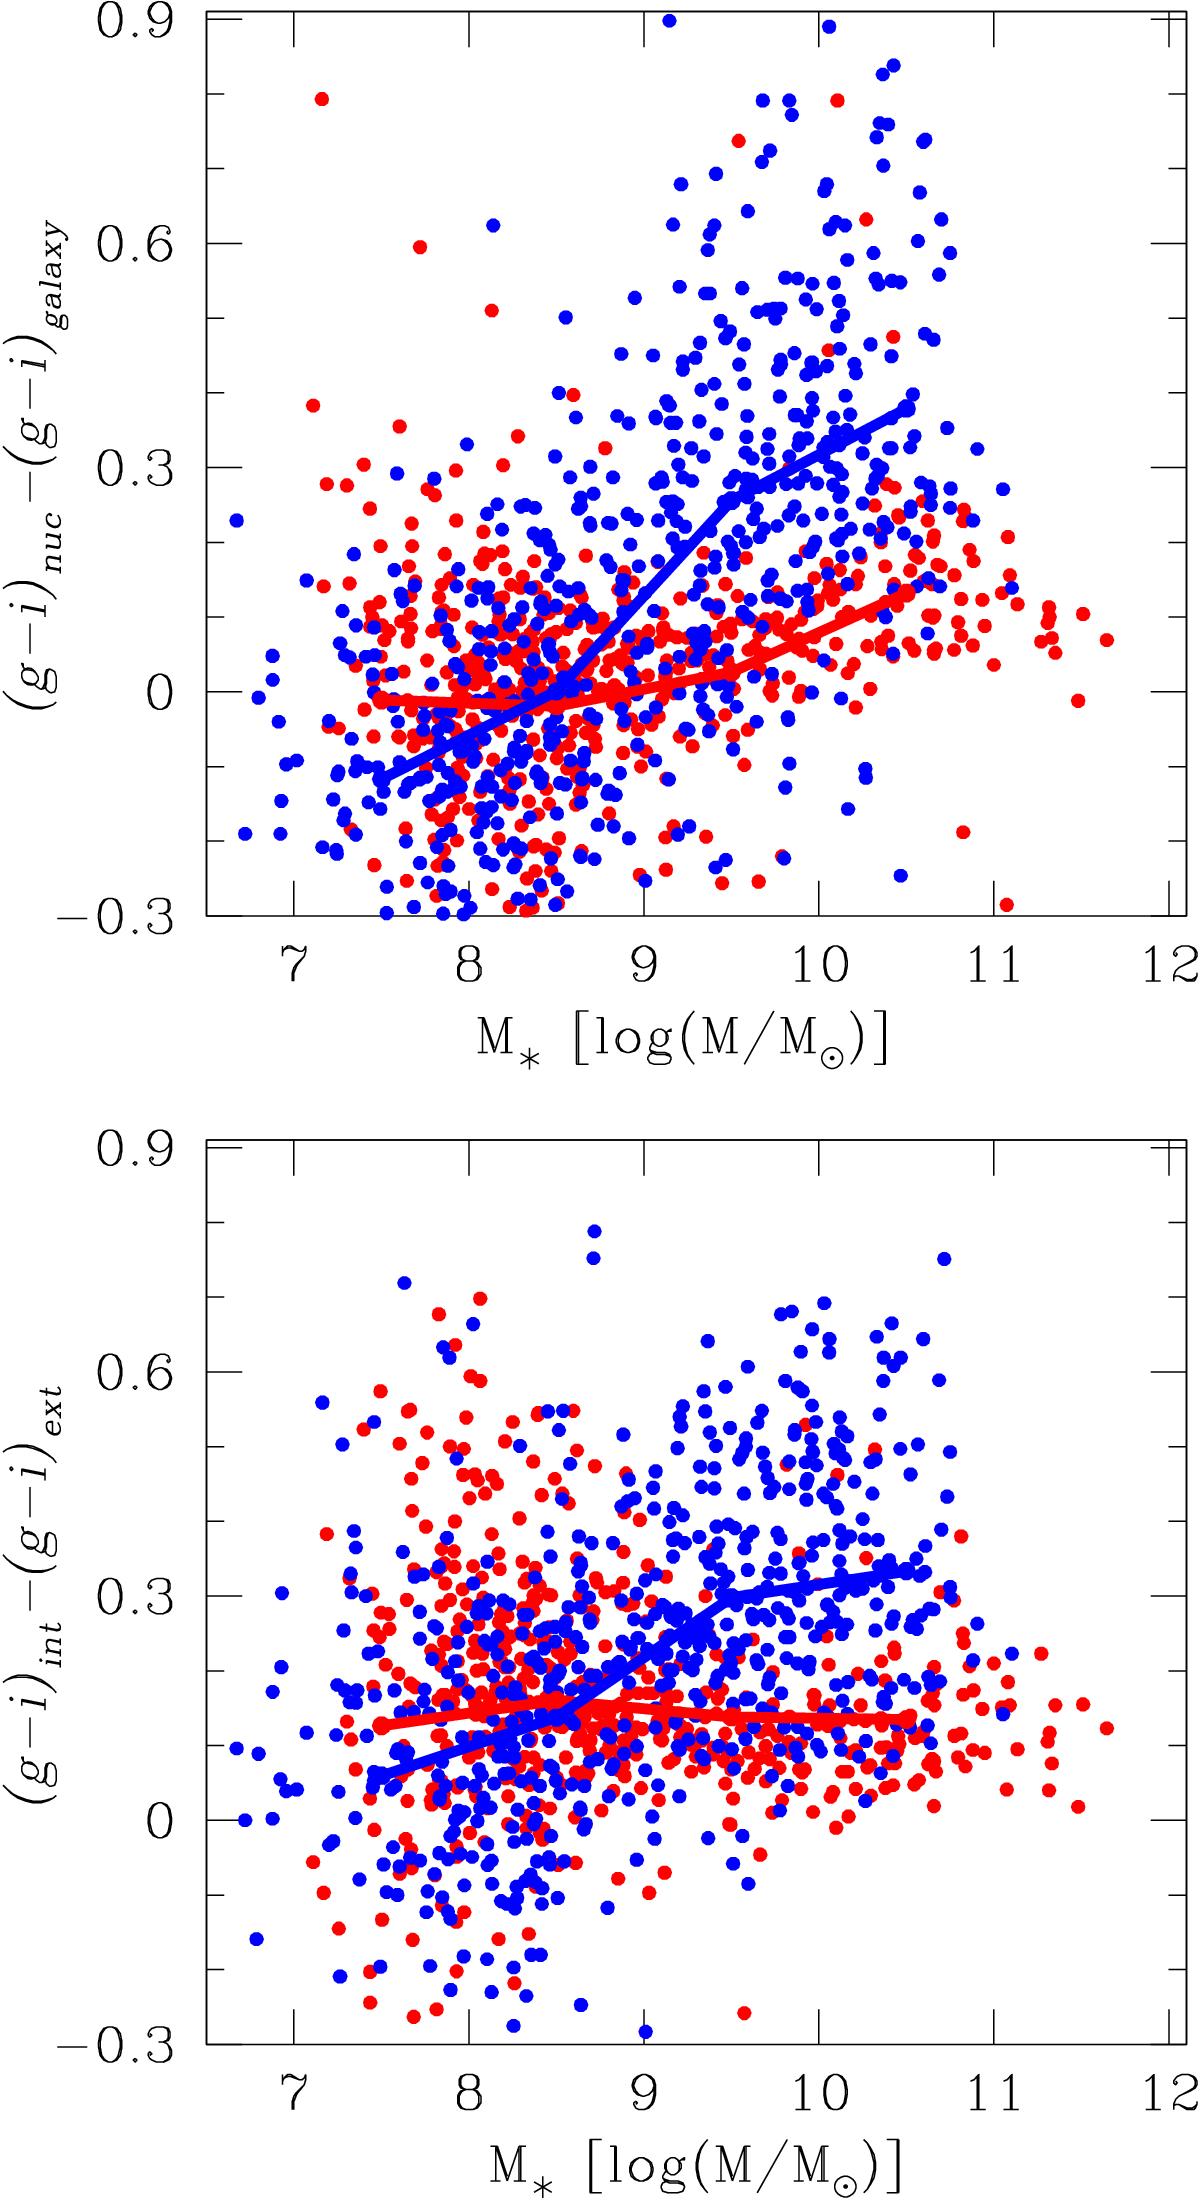
Top: distribution of the difference between the color indexes of the nuclear zone and the color of the galaxy plotted against the total stellar mass. Bottom: distribution of the difference between the color indexes of the intermediate zone and those of the disk-dominated zone plotted against the total stellar mass. In both panels, the blue and red small dots stand for respectively the blue cloud and the red sequence galaxies. The blue (red) line connects the average value in 4 bins of 10log (M/M⊙) from 107 to 1011 M⊙ for LTGs (ETGs).
Current usage metrics show cumulative count of Article Views (full-text article views including HTML views, PDF and ePub downloads, according to the available data) and Abstracts Views on Vision4Press platform.
Data correspond to usage on the plateform after 2015. The current usage metrics is available 48-96 hours after online publication and is updated daily on week days.
Initial download of the metrics may take a while.