Fig. 11
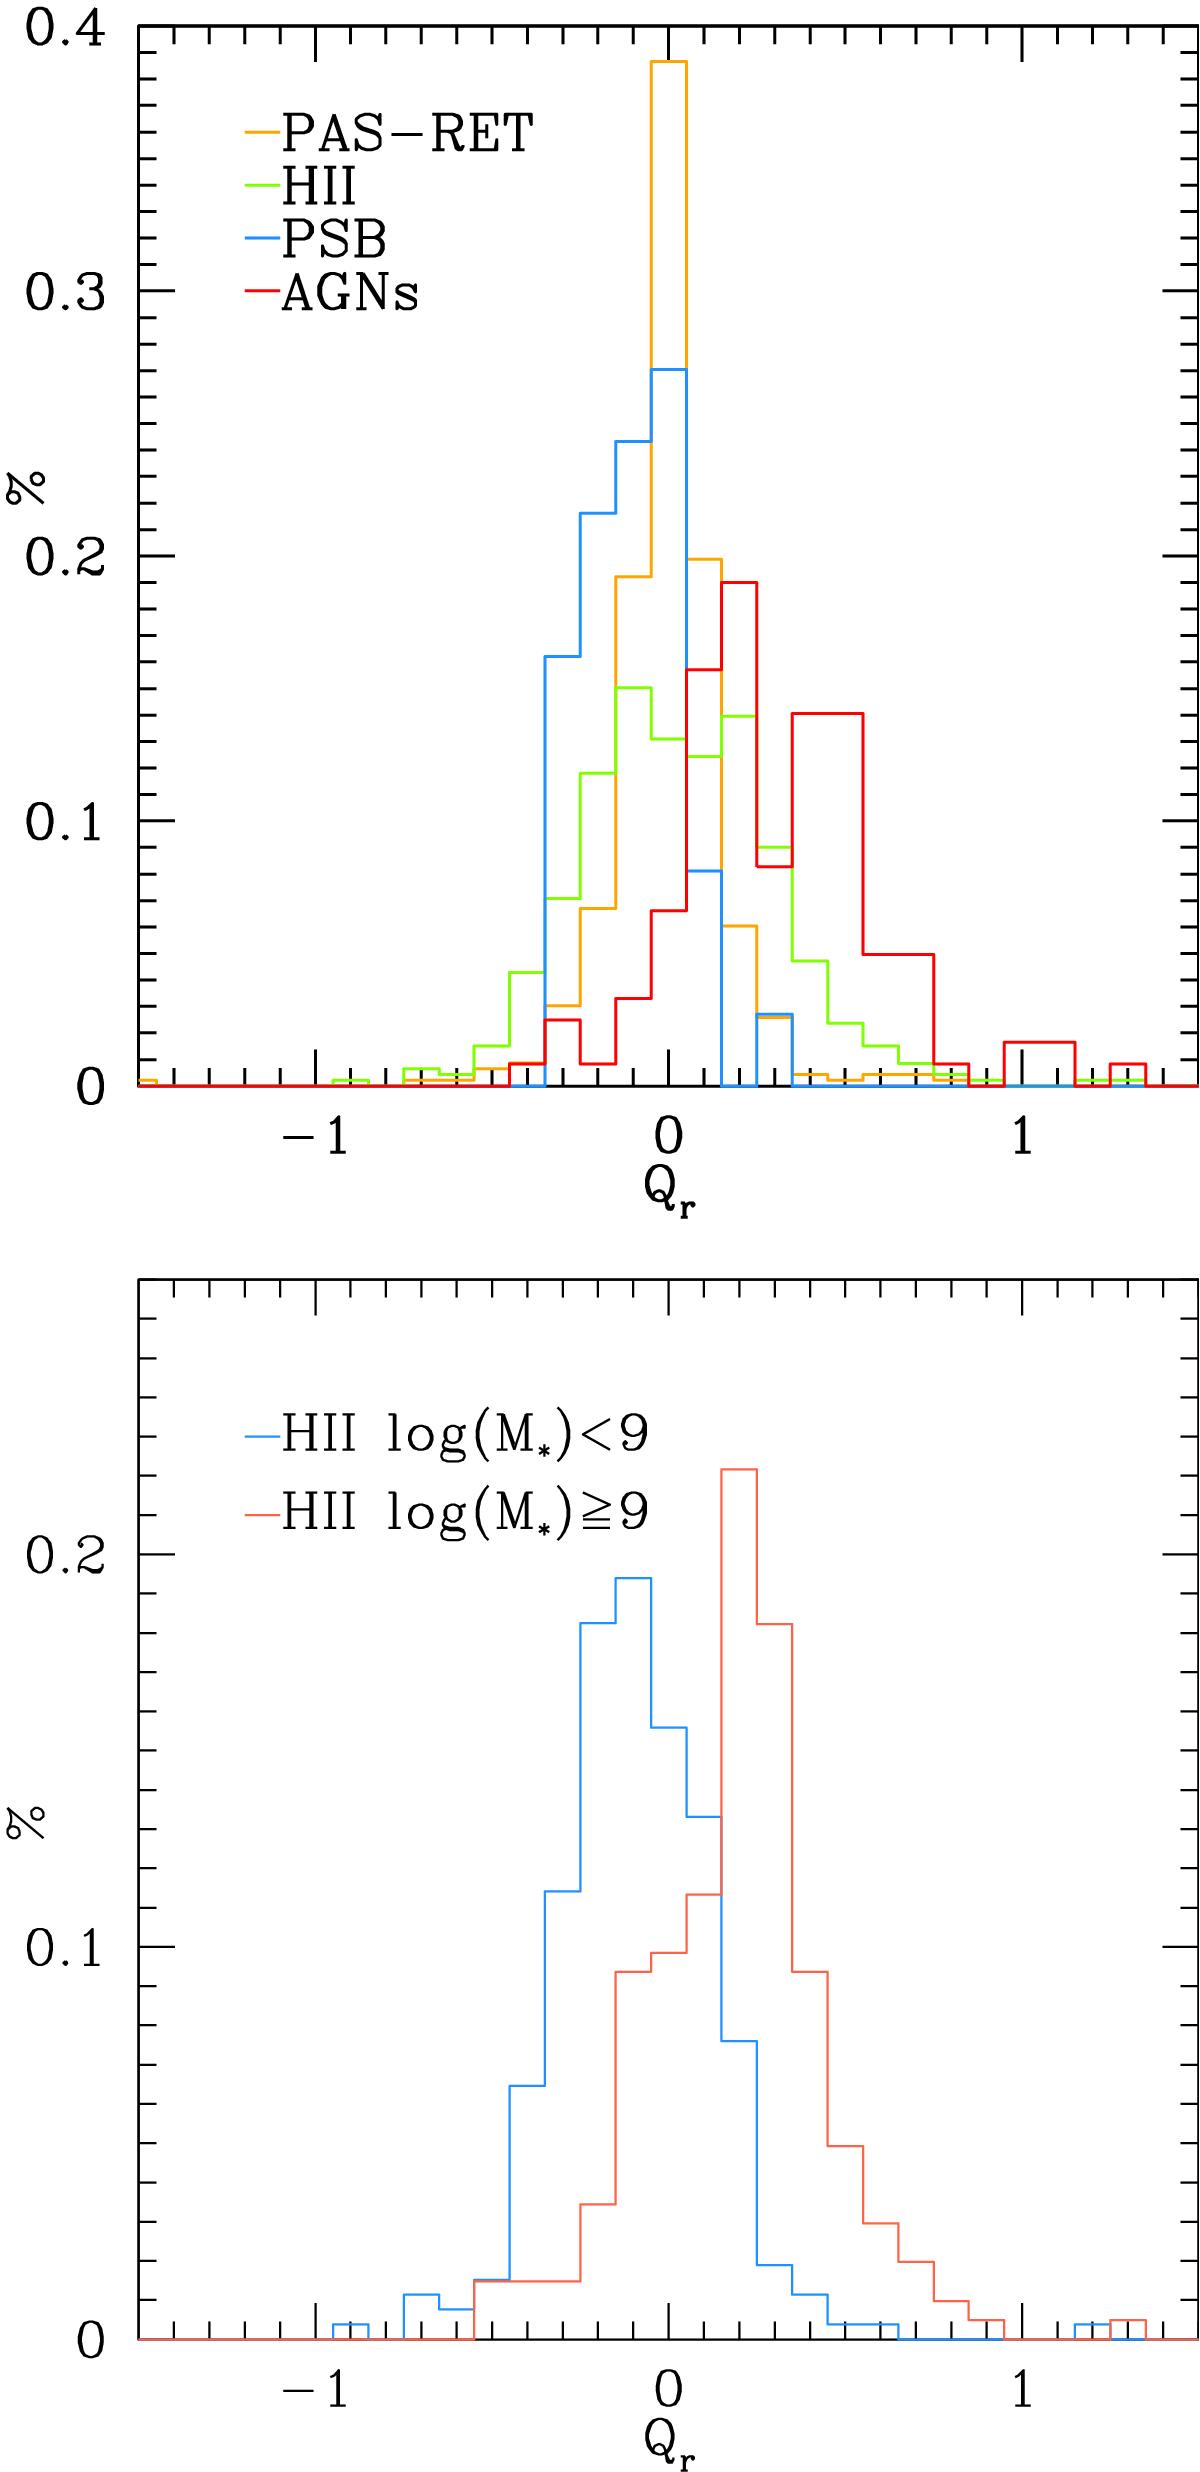
Top: normalized distributions of the nuclear reddening Qr indices for different classes of nuclear activity (computed following Cid Fernandes et al. 2011) color coded as follows: AGNs are represented by a red line; the PSBs distribution is traced by the blu line; the green line stands for HII-like nuclei and the orange for PASSIVE and Retired galaxies. Bottom: normalized distributions of HII-like nuclei above (red) and below (blue) 109 M⊙.
Current usage metrics show cumulative count of Article Views (full-text article views including HTML views, PDF and ePub downloads, according to the available data) and Abstracts Views on Vision4Press platform.
Data correspond to usage on the plateform after 2015. The current usage metrics is available 48-96 hours after online publication and is updated daily on week days.
Initial download of the metrics may take a while.