Fig. 10
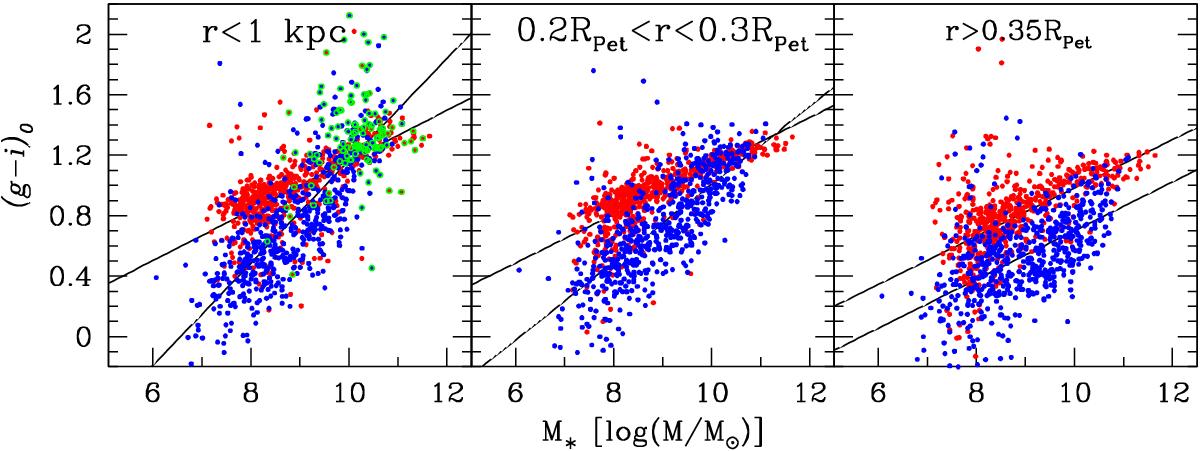
Color−magnitude diagram of three different zones where red dots are ETGs and blue dots are LTGs: (left panel) inner zone, where open green dots are galaxies hosting an active galactic nucleus of different kinds (LINERs, Seyfert, AGN) classified on the basis of nuclear emission lines; (central panel) intermediate zone; right panel: outer, disk-dominated zone.
Current usage metrics show cumulative count of Article Views (full-text article views including HTML views, PDF and ePub downloads, according to the available data) and Abstracts Views on Vision4Press platform.
Data correspond to usage on the plateform after 2015. The current usage metrics is available 48-96 hours after online publication and is updated daily on week days.
Initial download of the metrics may take a while.