Fig. 14
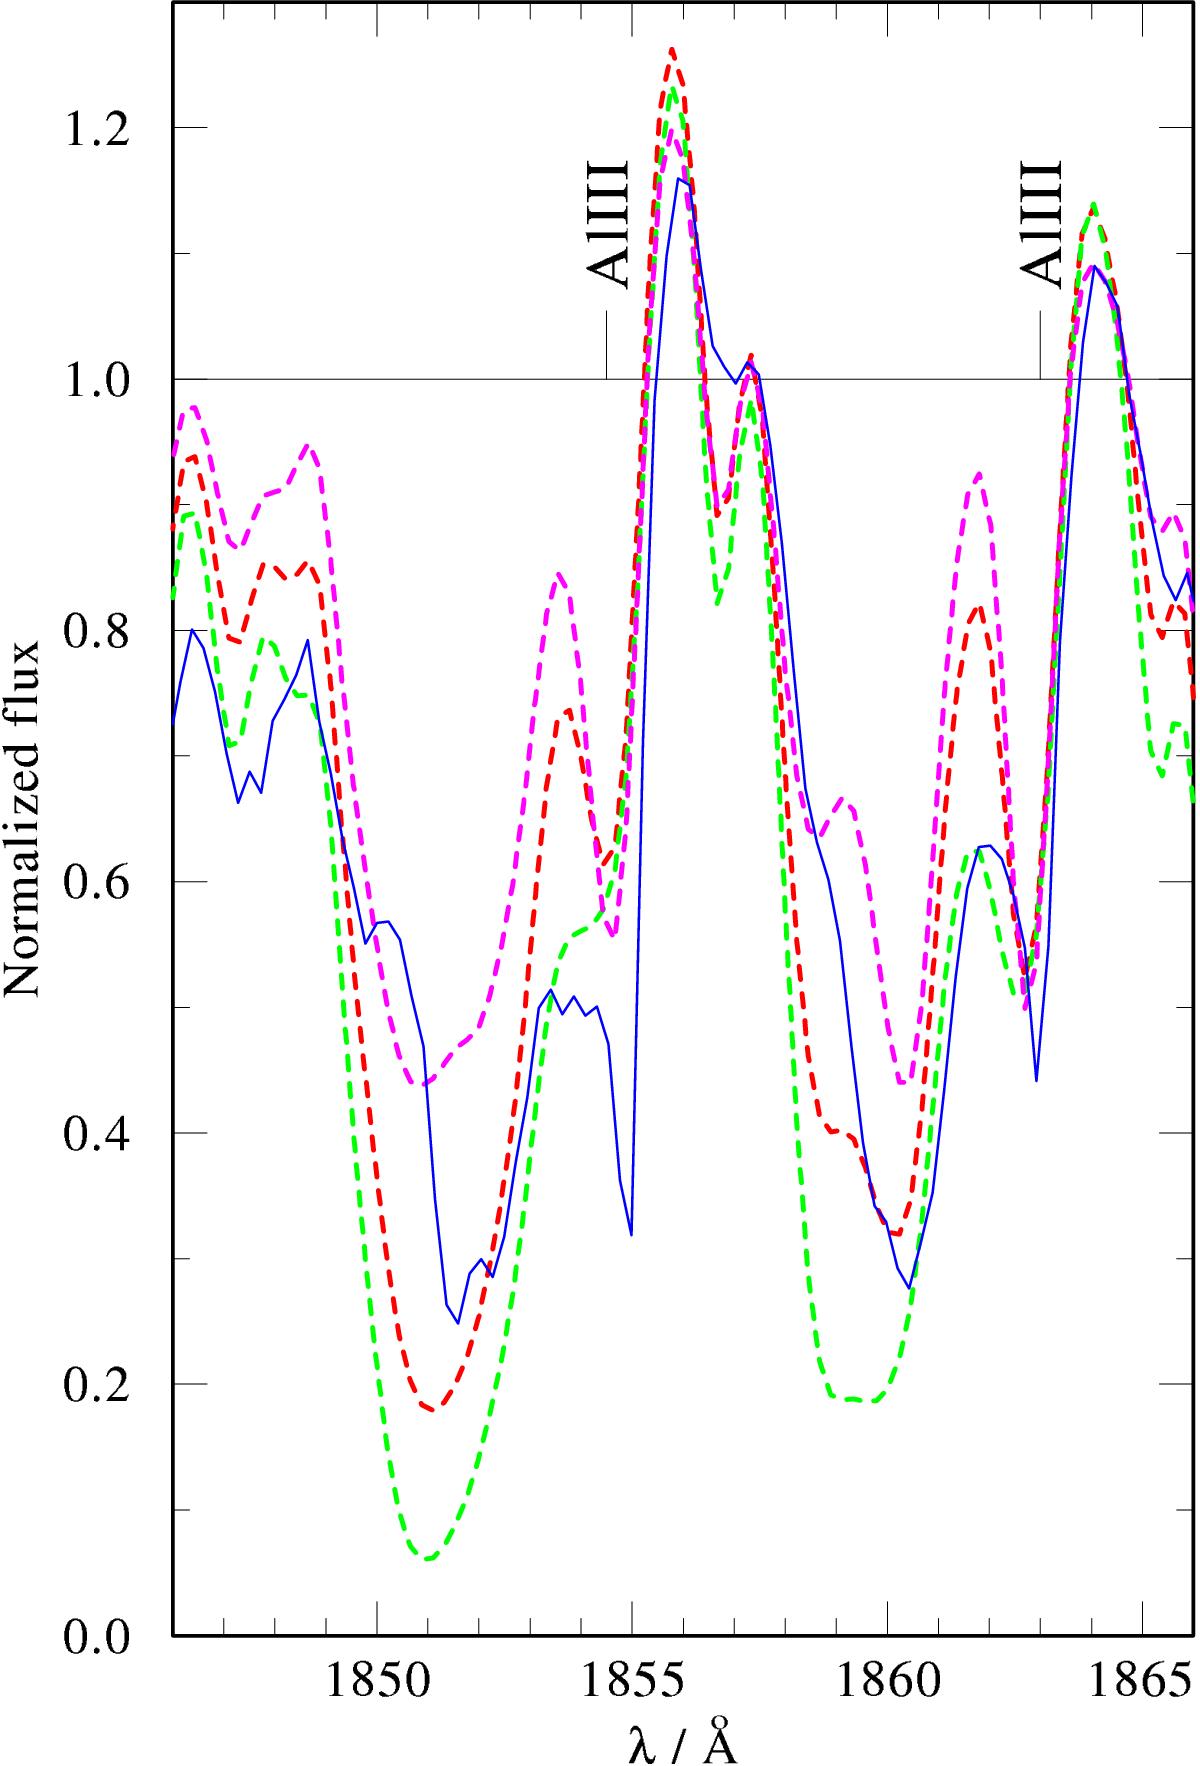
Al iii resonance lines λ1855 and λ1863Å, employed for the Ṁ estimation in Vela X-1. We show the observation (solid blue line), best-fit model (Ṁ = 10-6.2M⊙/yr, D = 11, red dashed line), a model with higher Ṁ (Ṁ = 10-5.8M⊙/yr, D = 2, green dashed line), and a model with lower Ṁ (Ṁ = 10-6.3M⊙/yr, D = 20, pink dashed line).
Current usage metrics show cumulative count of Article Views (full-text article views including HTML views, PDF and ePub downloads, according to the available data) and Abstracts Views on Vision4Press platform.
Data correspond to usage on the plateform after 2015. The current usage metrics is available 48-96 hours after online publication and is updated daily on week days.
Initial download of the metrics may take a while.