Fig. 13
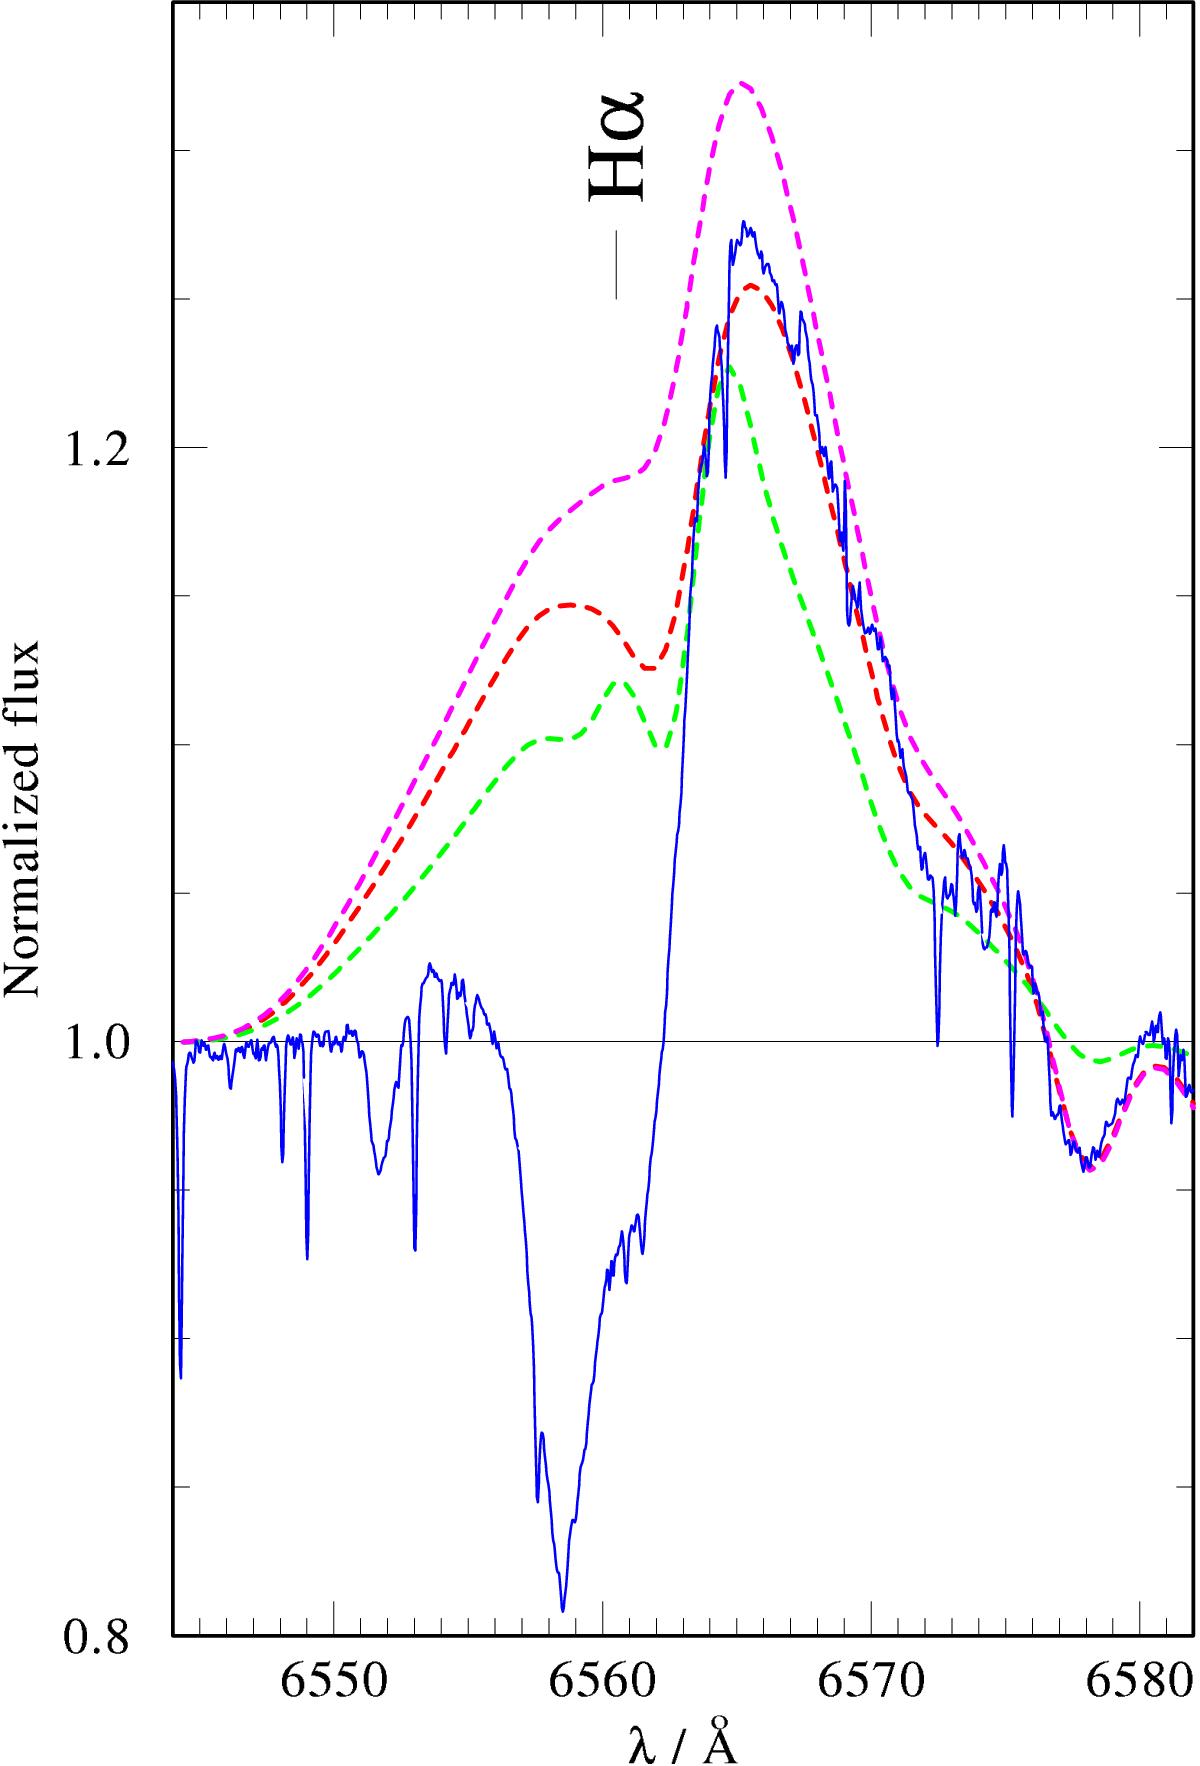
Hα
line for the estimation of ![]() in Vela X-1. We can see the
observation (blue solid line), best-fit model (red dashed line), a model with
0.8 times the
in Vela X-1. We can see the
observation (blue solid line), best-fit model (red dashed line), a model with
0.8 times the
![]() value of the best fit (green dashed
line), and a model with 1.2 times the
value of the best fit (green dashed
line), and a model with 1.2 times the ![]() value of the best fit (pink dashed
line).
value of the best fit (pink dashed
line).
Current usage metrics show cumulative count of Article Views (full-text article views including HTML views, PDF and ePub downloads, according to the available data) and Abstracts Views on Vision4Press platform.
Data correspond to usage on the plateform after 2015. The current usage metrics is available 48-96 hours after online publication and is updated daily on week days.
Initial download of the metrics may take a while.