| Issue |
A&A
Volume 591, July 2016
|
|
|---|---|---|
| Article Number | A89 | |
| Number of page(s) | 8 | |
| Section | Stellar structure and evolution | |
| DOI | https://doi.org/10.1051/0004-6361/201527542 | |
| Published online | 20 June 2016 | |
Chromospheric activity and evolutionary age of the Sun and four solar twins
1 Hamburger Sternwarte, Universität Hamburg, Gojenbergsweg 112, 21029 Hamburg, Germany
e-mail: This email address is being protected from spambots. You need JavaScript enabled to view it.
2 Departamento de Astronomia, Universidad de Guanajuato, 36000 Guanajuato, Mexico
Received: 12 October 2015
Accepted: 8 March 2016
Abstract
Aims. The activity levels of the solar-twin candidates HD 101364 and HD 197027 are measured and compared with the Sun, the known solar twin 18 Sco, and the solar-like star 51 Peg. Furthermore, the absolute ages of these five objects are estimated from their positions in the HR diagram and the evolutionary (relative) age compared with their activity levels.
Methods. To represent the activity level of these stars, the Mount Wilson S-indices were used. To obtain consistent ages and evolutionary advance on the main sequence, we used evolutionary tracks calculated with the Cambridge Stellar Evolution Code.
Results. From our spectroscopic observations of HD 101364 and HD 197027 and based on the established calibration procedures, the respective Mount Wilson S-indices are determined. We find that the chromospheric activity of both stars is comparable with the present activity level of the Sun and that of 18 Sco, at least for the period in consideration. Furthermore, the absolute age of HD 101364, HD 197027, 51 Peg, and 18 Sco are found to be 7.2, 7.1, 6.1, and 5.1 Gyr, respectively.
Conclusions. With the exception of 51 Peg, which has a significantly higher metallicity and a mass higher by about 10% than the Sun, the present Sun and its twins compare relatively well in their activity levels, even though the other twins are somewhat older. Even though 51 Peg has a similar age of 6.1 Gyr, this star is significantly less active. Only when we compare it on a relative age scale (which is about 20% shorter for 51 Peg than for the Sun in absolute terms) and use the higher-than-present long-term SMWO average of 0.18 for the Sun, does the S-index show a good correlation with evolutionary (relative) age. This shows that in the search for a suitably similar solar twin, the relative main-sequence age matters for obtaining a comparable activity level.
Key words: stars: activity / stars: chromospheres / stars: late-type
© ESO, 2016
1. Introduction
Solar twins are very important since they allow astrophysicists to look into the past and future of the Sun. For a star to be considered as a solar twin, its respective stellar parameters must be very similar to those of the Sun. It is not sufficient that the candidate star be located in the same place of the empirical HR diagram, the candidate star must also have a metallicity similar to that of the Sun and possess a similar evolutionary age. For young stars, sensitive age indicators are rotation, magnetic activity (e.g. Mamajek & Hillenbrand 2008), and lithium abundance, all of which considerably diminish during the main-sequence (MS) lifetime of a star. By contrast, evolutionary effects become more visible in the HR diagram only in the second half of this phase, just when the former indicators become less and less sensitive and more ambiguous.
One of the best solar twins appears to be 18 Sco, a star quite similar to our Sun (Porto de Mello & da Silva 1997). 18 Sco was used as comparison star in a study of HD 101364 by Melendez et al. (2012), who described HD 101364 as a “remarkable solar twin” with an age estimate of (3.5 ± 0.7) Gyr from the lithium abundance, not too far from the age of 18 Sco, which Melendez et al. (2012) estimated as 2.7 Gyr. Monroe et al. (2013) presented the star HD 197027 as a solar twin with an age of 8.2 Gyr, while, by comparison, our Sun only has an age of ≈4.5 Gyr, which is a factor ofabout2 lower than the above age estimate of HD 197027; the same authors estimated an age of 2.9 Gyr for 18 Sco. The same star was studied by Ramírez et al. (2014), who presented  values and ages for 18 Sco and HD 197027. While their values are similar, the ages are not, since they estimated the age of 18 Sco to be 3 Gyr and that of HD 197027 to be 6.7 Gyr.
To study the later activity evolution of our Sun, a more evolved MS star is clearly desirable. We therefore selected 51 Peg, a star with a somewhat higher mass and metallicity than the Sun. This higher mass and metallicity mean that 51 Peg evolved somewhat faster than the Sun. In this way, 51 Peg serves as a good reference for the future solar activity evolution as a late MS star even though its absolute age is comparable.
To study the activity–age relation, a reliable mean SMWO-index is needed to represent the mean level of chromospheric activity of the star. Therefore, measurements over a long period are required because chromospheric activity is a phenomenon exhibiting variability on both short and longer timescales. The Sun, the solar twin 18 Sco, and the evolved solar-like star 51 Peg are all included in our stellar activity long-term monitoring program to study chromospheric activity with our TIGRE telescope. We therefore have obtained quite a large number of SMWO values for these three objects.
To compare the chromospheric activity of the Sun, the solar twin 18 Sco, the evolved solar-like star 51 Peg, HD 101364, and HD 197027, we can directly use the S-index because all these stars and the Sun have very comparable B−V colour indices. In this case, the Mount Wilson S-index is suited best because it is the more empirical and less B−V-dependent activity indicator compared to the value. In addition, we estimate the ages of all four object by matching their HR diagram positions with suitable evolutionary tracks to cross check these results with the determined activity levels. Interestingly, recent studies (Reiners & Mohanty 2012; Schröder et al. 2013) of solar-like MS stars with some range of mass showed that the relative age of a star, that is, its absolute age τ with respect to some reference age, compares best with the activity level and not with the absolute age itself; we return to this point below.
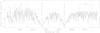 |
Fig. 1 TIGRE spectrum of the Sun (moonlight) with the band-passes used in the STIGRE measurement. |
2. Observation and data reduction
During the past years, we have regularly observed the Sun (to be precise, we took moonlight spectra), 18 Sco, 51 Peg, HD 101364, and HD 197027 with the TIGRE telescope, which is a 1.2 m robotic telescope located at the La Luz Observatory on a plateau in central Mexico. TIGRE’s only instrument is its fibre-fed Échelle spectrograph HEROS, which allows for simultaneous exposures in two spectral channels (a blue and red spectral range) with a total spectral coverage from ≈3800 Å to 8800 Å with a gap of ≈100 Å centred on 5800 Å and a spectral resolution of R ≈ 20 000; a more detailed description of the TIGRE facility is given by Schmitt et al. (2014).
The observational epochs, the number of observations, the visual magnitude,
Object and observational information.
and the mean S/N in the Ca II H&K region (3880−4020 Å) are provided in Table 1 for the stars we studied here. All spectroscopic data were reduced with the TIGRE/HEROS standard reduction pipeline, which is implemented in IDL and based on the IDL reduction package REDUCE written by Piskunov & Valenti (2002). The TIGRE/HEROS standard reduction pipeline is a fully automatic pipeline with an automatic wavelength calibration based on ThAr spectra. This pipeline includes all necessary reduction steps to reduce Échelle spectra (bias subtraction, order definition, wavelength calibration, spectral extraction, and flat fielding).
Dark current and its noise are very low in our data. Therefore, the dark subtraction was neglected. We removed the mean dark level by a precise spectrum background correction. The dark noise is generally lower than the readout noise and thus negligible as well. A master flat-field image created as the average image from individual exposures of a tungsten lamp taken at the beginning and the end of an observing night. For flat fielding the spectrum from the master flat-field image (thereafter: blaze) was extracted and the science spectrum was divided by the corresponding blaze. With this step, the blaze function is removed and the correction of the quantum efficiency is achieved. The fringes in the spectrum of the red channel are also removed. To obtain the final spectrum that covers a wide range of wavelengths, all single extracted and blaze-normalised spectral orders were combined and the overlap regions were merged.
3. Mount Wilson S-index calibration
The so-called Mount Wilson S-index (hereafter SMWO) is a very important and widely used activity indicator for cool stars. For a large number of stars and the Sun, S-index measurements have been available since the 1960s, in some cases covering up to five decades of monitoring undertaken primarily at Mt. Wilson, but also at the Lick and Lowell observatories.
The S-index is based on the chromospheric emission in the Ca II H&K line cores, which has originally been defined as the ratio of the counts in a triangular band-pass with a FWHM of 1.09 Å centred on the Ca II H&K lines, denoted by NH and NK in the following, over the counts of two 20 Å wide band-passes centred on 3901.07 Å and 4001.07 Å, denoted by NR and NV, respectively. A multiplicative factor α (Vaughan et al. 1978; Duncan et al. 1991) is introduced to adjust different instruments to the same S-index scale, so that the definition of the SMWO is (Vaughan et al. 1978)  (1)One of the key projects pursued by the TIGRE telescope is monitoring the stellar activity of a sizable stellar sample in Ca II H&K and other chromospheric lines. To measure the activity, we first determined our own TIGRE S-index, which we call STIGRE in the following, from the Ca II H&K lines. These STIGRE values were calculated from the blaze-normalised and echelle-order-merged spectra, after first performing a barycentric velocity and a radial velocity correction of the Ca II H&K region. The barycentric velocity shift was estimated as part of the data reduction process and stored in the header of each spectrum. To obtain the radial velocity shift of the Ca II H&K region, each spectrum was compared, guided by a cross correlation, with a synthetic spectrum calculated with the atmospheric model code PHOENIX (Hauschildt et al. 1999). For a realistic application of these synthetic spectra, the rotational line-broadening of each object by v·sin (i) and the resolution of the spectrograph (R ≈ 20 000) were taken into account. After the radial velocity correction, the counts in all four band passes were integrated and the ratio between the counts of the line centres and those from the quasi-continua were calculated. The error of the STIGRE-index was determined by error propagation of the standard deviation of the four integrals. These integral variations were estimated by means of a Monte Carlo simulation, where the S/N of a single pixel was considered. As an example of a typical TIGRE spectrum in the Ca II H&K region, we show in Fig. 1 a spectrum of the Sun (i.e., of moonlight); the band-passes defining the S-index are included for illustration.
A main difference between the STIGRE index and the classical S-index is that the TIGRE S-measurements are performed with a rectangular (not triangular as for Mt. Wilson) band-pass of 1 Å at the line centre. To compare our numerically integrated results with the original Mt. Wilson measurements, we must transform the STIGRE values to the Mt. Wilson system by considering a set of calibration stars (essentially to determine the α parameter in Eq. (1)).
For this purpose, we regularly observed a sample of 50 stars with very well
Set of calibration stars observed regularly to guarantee the correct transformation of the TIGRE S-index into the Mount Wilson S-index.
known SMWO values. These stars (see Table 2) were selected from the lists of Baliunas et al. (1995) and Hall et al. (2007b), as they are known to be relatively constant in their level of activity, that is, do not show any clear or significant periodic behaviour in their chromospheric emission. A borderline case with a period, however, is the very active star HD 201091 (see the Mount Wilson time series from Baliunas et al. 1995, Fig. 1g for HD 201091). As the reference Mount Wilson S-value for any required epoch, we here used a simple sine function with a period of 7.3 yr, an amplitude in SMWO of 0.05, and a baseline value of 0.658.
The TIGRE spectra for the objects listed in Table 2 were obtained between August 2013 and May 2015. To determine reliable mean STIGRE values for this period, each star was observed at least ten times. In Fig. 2 we compare our results to the literature SMWO values by plotting SMWO values vs. our STIGRE values. A clear linear correlation is obvious, with a regression curve of  (2)The solid line in Fig. 2 represents this regression curve, with a standard deviation of the residuals of 0.02. Furthermore, the percentage variation between the calculated and the corresponding reference
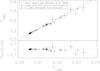 |
Fig. 2 SMWO index vs. STIGRE index. Upper panel: SMWO index vs. STIGRE index, the solid line shows the best linear fit, which converts the STIGRE index into the calibrated SMWO index. Lower panel: the residuals. |
SMWO is only 3.3%.
From Fig. 2 it is obvious that the scatter is smaller for the lower SMWO values (STIGRE ≲ 0.015 or SMWO ≲ 0.36) than for the more active cases. We estimate a scatter between the calculated and the original reference values of SMWO of only 2.3% for STIGRE< 0.015, but 6.8% (a scatter three times larger) for the values above. Fortunately, the here discussed solar twin stars are all in the lower range (SMWO ≲ 0.2) and so are not affected. The reason for this less certain transformation of STIGRE to SMWO values in the active range must obviously be attributed to the fact that more active stars, even the non-periodic ones, are significantly less stable over long timescales than the stars of a very modest activity level, which emit chromospheric fluxes much closer to the basal level. However, with longer time series we will eventually also increase the accuracy of the transformation for these more active stars.
Additionally, the STIGRE indices of the calibration stars were checked for the colour dependence in the relation between the indices STIGRE and SMWO. Therefore, only low-activity stars with STIGRE< 0.015 were used. These stars were divided into different B−V ranges and are plotted in Fig. 3, where the stars are labelled according to the different B−V ranges; we find no significant colour dependence of the relation between the STIGRE and SMWO indices.
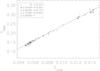 |
Fig. 3 SMWO-index vs. STIGRE-index. Zoom into the relation, and the S values are labelled for the different B−V ranges. The solid line shows the linear relation. |
Finally, the regression line between the STIGRE and SMWO indices does not pass exactly through the origin, contrary to what might have been expected. The reason for this may be the slightly different determination of the S values. Keep in mind that the lowest real S-values come from stars where the S-values are at the basal flux level. For giants, the basal flux level is SMWO = 0.086, which is higher by than a factor 2 than the constant value of 0.036. For the MS stars these differences between basal flux and the constant are even larger (Mittag et al. 2013). This constant offset in the calibrated transformation relation is not physically relevant and is much lower than the basal flux level.
4. Chromospheric activity
To compare the activity levels of HD 101364 and HD 197027 with the known solar-like stars 18 Sco and 51 Peg and with the Sun itself, we used their calibrated Mount Wilson S-index values. The STIGRE values for the Sun, 18 Sco, 51 Peg, and HD 101364 were determined automatically by a tool in the standard TIGRE data reduction pipeline, according to the description given in Sect. 3, but for HD 197027 an additional outlier correction was necessary before the STIGRE could be measured with the tool described in Sect. 3. The reason for this additional correction is the relatively low S/N of the spectra in comparison to the other sample objects. Because HD 197027 is the faintest star in our sample, it suffers most when observing time is lost due to unstable weather conditions. This change was also taken into account for averaging the STIGRE indices for HD 197027. Here, the single STIGRE-index values were weighted for averaging them with the corresponding S/N in the Ca II H&K region.
The mean STIGRE values for the five objects were transformed into the Mount Wilson S-scale using Eq. (2), and the results are listed in Table 3.
Results of the the S-index measurements with TIGRE.
The SMWO-values obtained for HD 101364 and HD 197027 are of the same order as the current activity levels of the Sun and 18 Sco. For HD 197027 this result was completely unexpected because the activity level for a supposedly old solar-like star is expected to be the near the basal flux level (Schröder et al. 2013) at SMWO = 0.144 (Mittag et al. 2013), which is the case for the more evolved solar-like star 51 Peg. However, on a longer term scale, the SMWO values we sampled over a period of about 20 months are only snapshots and may therefore not entirely represent the true stellar mean activity. For the Sun and 18 Sco we know that the activity in the Ca II H&K lines show long-term periodic variations on timescales of 11 and 7.1 yr, respectively (Baliunas et al. 1995; Hall et al. 2007b,a). This might in principle also be true for HD 101364 and HD 197027, for which we currently have only a few measurements. Consequently, some uncertainty remains as to how representative the obtained SMWO values of the long-term activity level of HD 101364 and HD 197027 really are; they could, by bad luck, instead be indicative of a maximum or a minimum state. More observations of these stars are therefore required.
5. Rotation periods
According to the rotation-age-activity paradigm, the rotation period of a star is also a good indicator of its chromospheric activity level (Noyes et al. 1984). Unfortunately, the rotation periods of HD 101364 and HD 197027 are still unknown, and our time series are still insufficient for a good determination. By contrast, the solar rotation period is of course very well determined, and for 18 Sco a period of 22.7 days has been established by Petit et al. (2008) with a quoted error of 0.5 days. To determine this period, Petit et al. (2008) used ten observations that covered about one and a half rotations. By comparison, Saar & Osten (1997) estimated the rotation period of 18 Sco to be 23.7 days, using the Noyes relation (Noyes et al. 1984) between rotation period and Rossby number, respectively, and log  (Saar, priv. comm.). For 51 Peg, a rather long period of 37.0 days was found by Baliunas et al. (1996) from Ca II H&K measurements, but the accuracy and significance of this period has not been discussed by Baliunas et al. (1996). Furthermore, a period of 29.7 days was calculated for 51 Peg by Noyes et al. (1984), while Soderblom (1985) obtained a period of about22 days. These calculated periods are shorter by 20% and 40%, respectively, than the period measured by Baliunas et al. (1996).
Using the Lomb-Scargle (LS) method (Horne & Baliunas 1986), we analysed our SMWO time series to check to which extent we recovered the known rotation period for the Sun. We checked the published rotation periods for 18 Sco and 51 Peg with a TIGRE-derived LS periodogram.
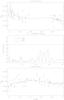 |
Fig. 4 Upper panel: SMWO time series of 18 Sco. The solid line represents a third-order polynomial fit, which was used for de-trending. Middle panel: periodogram of the time series. Bottom panel: phase-folded and de-trended time series. |
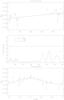 |
Fig. 5 SMWO time series of 51 Peg: the solid line represents the polynomial fit of the first order, which was used for the de-trending. In the middle the periodogram of the time series is shown, and the lower panel shows the phase-folded and de-trended time series. |
In our solar daily S-index series from 2014, we found a period of ≈26.7 days with a 3σ significance, which is well consistent with the solar synodic rotation period of 27.28 days (Cox 2000).
In Fig. 4 we present the TIGRE SMWO time series for 18 Sco. The raw data and a trend line are plotted in the top panel, the LS periodogram is shown in the middle panel, and in the bottom panel we show the time series folded with the most significant period; de-trending was accomplished by using a third-order polynomial. The periodogram reveals three peaks (21.9, 23.1, and 24.5 days) with a significance above 1σ around the value of 22.7 days derived by Petit et al. (2008). The highest peak in our periodogram (see Fig. 4) results in a period of 24.5 days with a significance of 95.3%, that is, almost at the 2σ level.
In Fig. 5 we present our TIGRE 51 Peg SMWO data and period analysis in the same way as in Fig. 4. Here we find a small linear trend in the time series, and the LS periodogram then shows two peaks above the 1σ level, pointing at periods of 37.4 days (formal significance 83%) and 41.5 days (formal significance 94.5%), both of which are comparable with the value published by Baliunas et al. (1996).
While the formal significance levels of the periods determined for 18 Sco and 51 Peg are below the 2σ level, the determined periods compare well with the literature values. Therefore, we conclude that our Lomb-Scargle results are likely consistent with the true rotational periods of the observed stars, and in particular, that 51 Peg rotates significantly more slowly than the Sun, while 18 Sco is a somewhat faster rotator.
6. Evolutionary ages, or how good is a solar twin?
Whether a star serves as a good solar twin does not only depend on the physical parameters luminosity L, effective temperature Teff , and metallicity ([Fe/H]), the star should also have a mass and age very similar to that of the Sun. On or near the MS, younger stars with slightly higher mass have the same effective temperature and are only slightly more luminous than their older siblings. Hence, a careful age analysis must be an important aspect in any discussion of solar twins.
Estimating stellar ages is notoriously difficult. The derived ages depend on the method used and to exacerbate the problem, the uncertainties tend to significantly increase with age. We consider 18 Sco. Published age estimates for this star range from 0.29 Gyr (Tsantaki et al. 2013) to 5.84 Gyr (Takeda et al. 2008), that is, from younger than the Hyades to older than the Sun. The youngest age is in clear contrast to all other published values, which give 18 Sco a more mature evolutionary status, closer to that of the Sun; our own result (see below) of 5.1 Gyr confirms this.
Summary of the used stellar parameters and our results of the age estimations.
To obtain a consistent interpretation of the HRD positions of all our sample stars and derive their absolute ages in a consistent manner, we employed our own evolutionary tracks that were computed with the Cambridge Stellar Evolution Code1 (Pols et al. 1997), which is an updated version of the work of Eggleton (1971). These evolutionary tracks, with appropriate choices of mass and metallicity, were then compared with the observed luminosities L and effective temperatures Teff of the stars, derived here from photometric data and trigonometric parallaxes.
Our Sun presents a way of testing this approach. An age determination based on isotopes of the oldest solar system meteorites leads to an empirical solar age of around 4.6 Gyr (Bouvier & Wadhwa 2010). On the other hand, the accuracy of evolutionary models still depends on their empirical calibration, despite the significant improvements in the opacity tables and the description of the equation of state, in particular for cooler plasmas. The main problem remaining, however, is the approximate description of convection, which still uses the mixing length approach, where the scaling factor (the mixing length) has to be calibrated against real stars and their physical properties. The uncertainty in such stellar data used for calibration leaves us with typical inconsistencies of the absolute age-scale of the order of 0.1 Gyr for models of solar-type stars. Hence, we individually calibrated the evolutionary model used here for the Sun, which now suggests a age of around 4.6 Gyr.
The parallax errors are most important because they affect the luminosity and consequently the age. The uncertainty in Teff, by contrast, translates mostly into a necessary variation of the stellar mass. We derived this in steps of Δ0.005 M⊙ for 51 Peg and Δ0.01 M⊙ for the other stars to cover the respective error margin around Teff. However, the uncertainty in metallicity also causes a shift in Teff of the respective evolutionary tracks and so adds to the effective uncertainty of the derived best-matching mass and age. Hence, the total error of the age was estimated by error propagation, using a whole range of such appropriate evolutionary tracks.
In Table 4 we list the absolute visual magnitudes MV metallicities, a mean Teff, and the estimated ages of our sample stars. For 18 Sco, 51 Peg, HD 101364, and HD 197027, the former were calculated from the revised Hipparcos parallaxes (van Leeuwen 2008), while photometric data (V and B−V values) were taken from the Hipparcos catalogue (ESA 1997).
The Teff values used for 18 Sco, 51 Peg, HD 101364, and HD 197027 are (unweighted) averages from all entries listed in the Pastel catalogue (Version 2013-04-01; Soubiran et al. 2010), and the respective standard deviation was used to estimate the uncertainty of Teff. For HD 197027 we also included the value Teff = 5723 K derived by Monroe et al. (2013).
The luminosities L/L⊙ were then derived directly from the resulting
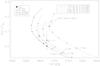 |
Fig. 6 Luminosity vs. effective temperature of the stars. The solid line shows the evolutionary track for 1 M⊙, the dash-dotted line for 0.99 M⊙, and the dash-triple-dotted line for 0.98 M⊙ with Z = 0.0185. The dashed line denotes the evolutionary track for 1.11 M⊙ and Z = 0.0196. The asterisk at the evolutionary track marks a time step of 1 Gyr, and the first step is labelled with the age. |
absolute visual magnitudes Mv by assuming that the bolometric correction BC is essentially the same for all sample stars. This simplification is justified because all Teff values are very comparable within their uncertainties, and any real differences would cause the BCs to differ by only a few hundredths of a magnitude. In comparison to the propagated parallax error, this error is negligible.
To represent the different metallicities by appropriate evolutionary tracks, we found that the evolutionary track with Z = 0.0185 (as for the Sun, equivalent to [Fe/H] = 0.00) represents our host star and its twins. For the stellar mass we found that the evolutionary tracks with 0.99 M⊙ for HD 101364 and with 0.98 M⊙ for HD 197027 represent the stars better than the track with 1 M⊙ like 18 Sco. For 51 Peg, by contrast, we used an evolutionary track computed for Z = 0.0296 and the respective opacity table (equivalent to [Fe/H] ≈ +0.20) to model the effect of the much higher metallicity of this star. In Fig. 6 all sample stars are plotted in the HR diagram together with the evolutionary tracks as detailed above. With an estimated age of (7.1 ± 1.5) Gyr and (7.2 ± 3.1) Gyr, HD 101364 and HD 197027 seem to be significantly older than the Sun, while 18 Sco appears to be a much closer match to the Sun with an estimated age of (5.1 ± 1.1) Gyr. However, if the age uncertainties of HD 197027 and 18 Sco are taken into account, they are then still comparable to the Sun. In particular, the age uncertainty for HD 197027 is quite large. To obtain a more precise age for this star, a more accurate parallax is needed in the first place, followed by a better Teff value.
In the special case of 51 Peg, we found that its higher luminosity and higher metallicity can be matched very well by a track of about 1.11 solar masses with Z = 0.0296. For the age of 51 Peg we then obtained (6.1 ± 0.6) Gyr. The higher metallicity of 51 Peg makes it slightly redder than the Sun, overcompensating for the effect of its higher mass. Another consequence of this higher mass is that the evolutionary MS timescale of 51 Peg is shorter by 20% than the Sun and the twins we discussed here.
With this lower MS life-expectancy, this star is the most advanced on the MS when compared to the Sun and its twins, even though its age as such does not immediately suggest this. Hence, the very low activity level of 51 Peg, when compared to the Sun and its twins, suggests a relation between activity level and evolutionary (or relative) age (absolute age/reference age) and not the absolute age, when different stellar life expectations are compared. But how can such different evolutionary models be compared when for such low masses a well-defined turn-off point as a physical and visible (in the HRD) reference point to the MS life-expectancy is lacking? In these stars that are close to one solar mass, hydrogen shell-burning sets in very gradually, and this process leaves no suitable mark on the HRD.
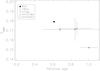 |
Fig. 7 SMWO value vs. relative age. Our estimated ages are derived from the reference ages, see Table 4. For the S values the mean literature values are used for the Sun, 18 Sco, and 51 Peg. For HD 101364, the literature SMWO value and our value are averaged, and only our SMWO-value was used for HD 197027. |
Therefore, as a well-defined (albeit not physically meaningful) reference point, we prefer to use the turn-around point of the evolutionary tracks in the HRD (see label in Fig. 6), which all stars of about one solar mass describe in the HRD during their later MS evolution. We use the age of the turn-around point as a reference age, although this location does not indicate any significant structural change in the star. However, it provides a well-defined location on the HRD, where the evolutionary tracks reverse their temperature trend with (growing) luminosity and become faster. For the tracks with Z = 0.0185 and a stellar mass of 1 M⊙, 0.99 M⊙ and 0.98 M⊙, the ages at these points are ≈7.5 Gyr, ≈8.2 Gyr, and ≈8.5 Gyr, while for 1.11M⊙ and Z = 0.0296, this age is ≈6.1 Gyr. In these terms, 51 Peg is much more evolved than the Sun, since it has reached 100% of its turn-around age compared to the Sun and its twins, which are at only 60% to 85% of this age. This relative age agrees much better with the respective activity levels.
This is depicted in Fig. 7. For this comparison we used our estimated relative age and a mean of the available literature SMWO values for the Sun, 18 Sco, and 51 Peg, which are more representative for their activity in the long term than our current snapshot SMWO values. For HD 197027, however, by lack of other choice we used our own SMWO value, while for HD 101364, we averaged the mean literature SMWO value obtained from Melendez et al. (2012) with our measurements.
7. Discussion and conclusion
Chromospheric activity is a phenomenon showing variability on long timescales (years and to centuries) caused by activity cycles and short timescales (days to years) produced by the evolution and rotational modulation of individual active regions. Hence, snapshot observations such as we used in this study may under- or overestimate the long-term level of chromospheric activity even though we averaged over many different nights. For more certainty, long-term monitoring is therefore necessary. As an example, we note that the long-term S-average from 1966−1992 (Baliunas et al. 1995) for the Sun is close to 0.18, covering three solar activity maxima and minima. Around the current relatively weak maximum, we record by contrast an average solar SMWO value of only about 0.17. We can rule out that this significant difference is caused by our calibration procedure because we used the same stars for our transformation to Mt. Wilson SMWO values as were used by O.C. Wilson and his group.
In particular, for modestly active stars with S< 0.2, the standard deviation of the residuals of our calibrated SMWO values compared with those from Baliunas et al. is as small as 0.004, and the mean variation amounts to only 2.3%. Furthermore, during the period when we measured the solar SMWO value of 0.17, sunspot counts were also on a lower level than in the solar cycles of 1966−1992. We therefore conclude that this difference is real and represents a real change of the solar activity on a longer (decades to century) timescale.
This casts some doubt as to how well the present snapshot SMWO value of 0.17 represents the long-term solar activity. However, when modern sunspot records are compared with historic observations, all uncertainties included, (SIDC 2015, communication of July 12) the second half of the past century (when Baliunas et al. 1995 obtained their SMWO value of 0.18) appears to have been above-average and so may portray a slightly too young Sun.
Interestingly, the snapshot observations of HD 101364 and HD 197027 we presented here show that their activity levels are more or less comparable with that of the current Sun and that of 18 Sco, but all of them clearly differ from 51 Peg, which exhibits a significantly and consistently lower activity. Exclusively from the point of view of stellar activity levels, we may therefore conclude that HD 101364 and HD 197027 are younger in the context of stellar evolution than the more evolved solar-like star 51 Peg, which has already come quite close to the basal flux level of its S-index. Compared to the Sun and 18 Sco, however, it might be assumed that HD 101364 and HD 197027 have a comparable age or are slightly older.
Using stellar ages obtained from the comparison of matching evolutionary tracks with the observed stellar HRD positions, we find that 51 Peg is, in absolute terms, not the oldest object in this small sample. However, when the faster MS evolution of 51 Peg is considered, we can show the same trend in the evolutionary advance as the one shown by the observed activity levels (see Fig. 7) because its mass is higher than those of the other four stars. These results confirm earlier work, that is, a better correspondence between activity level and relative MS age instead of absolute age, as shown by Reiners & Mohanty (2012) and Schröder et al. (2013).
Another important characteristic of a star is its rotation period. The rotation period is correlated with the chromospheric activity and with stellar age. This can also be seen in our very small sample of only three periods, which is in sufficient to show this correlation clearly. Nevertheless, we may say that the Sun and 18 Sco are comparable in age, in chromospheric activity, and in their rotation periods. Furthermore, the rotation of the Sun and 18 Sco is clearly faster than that of the evolved star 51 Peg. This finding agrees with the relation between evolutionary (relative) age and activity level shown in Fig. 7.
It is obvious from Fig. 7 that the same relation holds for the other two solar twins that we discussed here, HD 101364 and HD 197027. Even though this must still be confirmed by extending this study to a larger sample of solar-like stars, we may already conclude that first, the chromospheric activity level is a good age indicator, even for advanced evolutionary states, and that second, the two new solar-twin candidates (HD 101364 and HD 197027) and 18 Sco we discussed here are suitable matches to our Sun with respect to mass, metallicity, activity, and evolutionary age, even if they are perhaps slightly older, and third, in the search for a perfect twin, stellar age should be given more consideration because otherwise the activity level would not match that of the Sun.
Acknowledgments
This research has made valuable use of the VizieR catalogue access tool, CDS, Strasbourg, France. The original description of the VizieR service was published in A&AS, 143, 23. We are grateful for the financial support received from the DFG project No. SCHM 1032/49-1, and we further acknowledge travel support by bilateral grants CONACyT-DFG (No.192334) and CONACyT-DAAD (No. 207772) in the past two years, as well as by the CONACyT mobility grant (No. 207662).
References
- Baliunas, S. L., Donahue, R. A., Soon, W. H., et al. 1995, ApJ, 438, 269 [NASA ADS] [CrossRef] [Google Scholar]
- Baliunas, S., Sokoloff, D., & Soon, W. 1996, ApJ, 457, L99 [NASA ADS] [CrossRef] [Google Scholar]
- Bouvier, A., & Wadhwa, M. 2010, Nature Geoscience, 3, 637 [CrossRef] [Google Scholar]
- Cincunegui, C., Diaz, R. F., & Mauas, P. J. D. 2007, VizieR Online Data Catalog: J/A+A/469/309 [Google Scholar]
- Cox, A. N. 2000, Allen’s astrophysical quantities (New York: AIP Press; Springer) [Google Scholar]
- Duncan, D. K., Vaughan, A. H., Wilson, O. C., et al. 1991, ApJS, 76, 383 [NASA ADS] [CrossRef] [Google Scholar]
- Duncan, D. K., Vaughan, A. H., Wilson, O. C., et al. 2005, VizieR Online Data Catalog: III/159 [Google Scholar]
- Eggleton, P. P. 1971, MNRAS, 151, 351 [NASA ADS] [CrossRef] [Google Scholar]
- ESA 1997, The HIPPARCOS and TYCHO catalogues. Astrometric and photometric star catalogues derived from the ESA HIPPARCOS Space Astrometry Mission ESA SP, 1200 [Google Scholar]
- Gray, R. O., Corbally, C. J., Garrison, R. F., McFadden, M. T., & Robinson, P. E. 2003, AJ, 126, 2048 [NASA ADS] [CrossRef] [Google Scholar]
- Hall, J. C., Henry, G. W., & Lockwood, G. W. 2007a, AJ, 133, 2206 [NASA ADS] [CrossRef] [Google Scholar]
- Hall, J. C., Lockwood, G. W., & Skiff, B. A. 2007b, AJ, 133, 862 [NASA ADS] [CrossRef] [Google Scholar]
- Hauschildt, P. H., Allard, F., & Baron, E. 1999, ApJ, 512, 377 [NASA ADS] [CrossRef] [Google Scholar]
- Horne, J. H., & Baliunas, S. L. 1986, ApJ, 302, 757 [NASA ADS] [CrossRef] [Google Scholar]
- Isaacson, H., & Fischer, D. 2010, ApJ, 725, 875 [NASA ADS] [CrossRef] [Google Scholar]
- Jenkins, J. S., Murgas, F., Rojo, P., et al. 2011, VizieR Online Data Catalog: J/A+A/531/A8 [Google Scholar]
- Mamajek, E. E., & Hillenbrand, L. A. 2008, ApJ, 687, 1264 [NASA ADS] [CrossRef] [Google Scholar]
- Melendez, J., Bergemann, M., Cohen, J. G., et al. 2012, A&A, 543, A29 [NASA ADS] [CrossRef] [EDP Sciences] [Google Scholar]
- Mittag, M., Schmitt, J. H. M. M., & Schröder, K.-P. 2013, A&A, 549, A117 [NASA ADS] [CrossRef] [EDP Sciences] [Google Scholar]
- Monroe, T. R., Meléndez, J., Ramírez, I., et al. 2013, ApJ, 774, L32 [NASA ADS] [CrossRef] [Google Scholar]
- Noyes, R. W., Hartmann, L. W., Baliunas, S. L., Duncan, D. K., & Vaughan, A. H. 1984, ApJ, 279, 763 [NASA ADS] [CrossRef] [Google Scholar]
- Petit, P., Dintrans, B., Solanki, S. K., et al. 2008, MNRAS, 388, 80 [NASA ADS] [CrossRef] [MathSciNet] [Google Scholar]
- Piskunov, N. E., & Valenti, J. A. 2002, A&A, 385, 1095 [NASA ADS] [CrossRef] [EDP Sciences] [Google Scholar]
- Pols, O. R., Tout, C. A., Schroder, K.-P., Eggleton, P. P., & Manners, J. 1997, MNRAS, 289, 869 [NASA ADS] [CrossRef] [Google Scholar]
- Porto de Mello, G. F., & da Silva, L. 1997, ApJ, 482, L89 [NASA ADS] [CrossRef] [Google Scholar]
- Ramírez, I., Meléndez, J., Bean, J., et al. 2014, A&A, 572, A48 [NASA ADS] [CrossRef] [EDP Sciences] [Google Scholar]
- Reiners, A., & Mohanty, S. 2012, ApJ, 746, 43 [NASA ADS] [CrossRef] [Google Scholar]
- Saar, S. H., & Osten, R. A. 1997, MNRAS, 284, 803 [NASA ADS] [CrossRef] [Google Scholar]
- Schmitt, J. H. M. M., Schröder, K.-P., Rauw, G., et al. 2014, Astron. Nachr., 335, 787 [NASA ADS] [CrossRef] [Google Scholar]
- Schröder, K.-P., Mittag, M., Hempelmann, A., González-Pérez, J. N., & Schmitt, J. H. M. M. 2013, A&A, 554, A50 [NASA ADS] [CrossRef] [EDP Sciences] [Google Scholar]
- Soderblom, D. R. 1985, AJ, 90, 2103 [NASA ADS] [CrossRef] [Google Scholar]
- Soubiran, C., Le Campion, J.-F., Cayrel de Strobel, G., & Caillo, A. 2010, VizieR Online Data Catalog: B/pastel [Google Scholar]
- Takeda, G., Ford, E. B., Sills, A., et al. 2008, VizieR Online Data Catalog: J/ApJS/168/297 [Google Scholar]
- Tsantaki, M., Sousa, S. G., Adibekyan, V. Z., et al. 2013, VizieR Online Data Catalog: J/A+A/555/A150 [Google Scholar]
- Valenti, J. A., & Fischer, D. A. 2005, VizieR Online Data Catalog: J/ApJS/159/141 [Google Scholar]
- van Leeuwen, F. 2008, VizieR Online Data Catalog: I/311 [Google Scholar]
- Vaughan, A. H., Preston, G. W., & Wilson, O. C. 1978, PASP, 90, 267 [NASA ADS] [CrossRef] [Google Scholar]
- Wright, J. T., Marcy, G. W., Butler, R. P., & Vogt, S. S. 2004, VizieR Online Data Catalog: J/ApJS/152/261 [Google Scholar]
All Tables
Set of calibration stars observed regularly to guarantee the correct transformation of the TIGRE S-index into the Mount Wilson S-index.
All Figures
|
Fig. 1 TIGRE spectrum of the Sun (moonlight) with the band-passes used in the STIGRE measurement. |
| In the text | |
|
Fig. 2 SMWO index vs. STIGRE index. Upper panel: SMWO index vs. STIGRE index, the solid line shows the best linear fit, which converts the STIGRE index into the calibrated SMWO index. Lower panel: the residuals. |
| In the text | |
|
Fig. 3 SMWO-index vs. STIGRE-index. Zoom into the relation, and the S values are labelled for the different B−V ranges. The solid line shows the linear relation. |
| In the text | |
|
Fig. 4 Upper panel: SMWO time series of 18 Sco. The solid line represents a third-order polynomial fit, which was used for de-trending. Middle panel: periodogram of the time series. Bottom panel: phase-folded and de-trended time series. |
| In the text | |
|
Fig. 5 SMWO time series of 51 Peg: the solid line represents the polynomial fit of the first order, which was used for the de-trending. In the middle the periodogram of the time series is shown, and the lower panel shows the phase-folded and de-trended time series. |
| In the text | |
|
Fig. 6 Luminosity vs. effective temperature of the stars. The solid line shows the evolutionary track for 1 M⊙, the dash-dotted line for 0.99 M⊙, and the dash-triple-dotted line for 0.98 M⊙ with Z = 0.0185. The dashed line denotes the evolutionary track for 1.11 M⊙ and Z = 0.0196. The asterisk at the evolutionary track marks a time step of 1 Gyr, and the first step is labelled with the age. |
| In the text | |
|
Fig. 7 SMWO value vs. relative age. Our estimated ages are derived from the reference ages, see Table 4. For the S values the mean literature values are used for the Sun, 18 Sco, and 51 Peg. For HD 101364, the literature SMWO value and our value are averaged, and only our SMWO-value was used for HD 197027. |
| In the text | |
Current usage metrics show cumulative count of Article Views (full-text article views including HTML views, PDF and ePub downloads, according to the available data) and Abstracts Views on Vision4Press platform.
Data correspond to usage on the plateform after 2015. The current usage metrics is available 48-96 hours after online publication and is updated daily on week days.
Initial download of the metrics may take a while.