Fig. 4
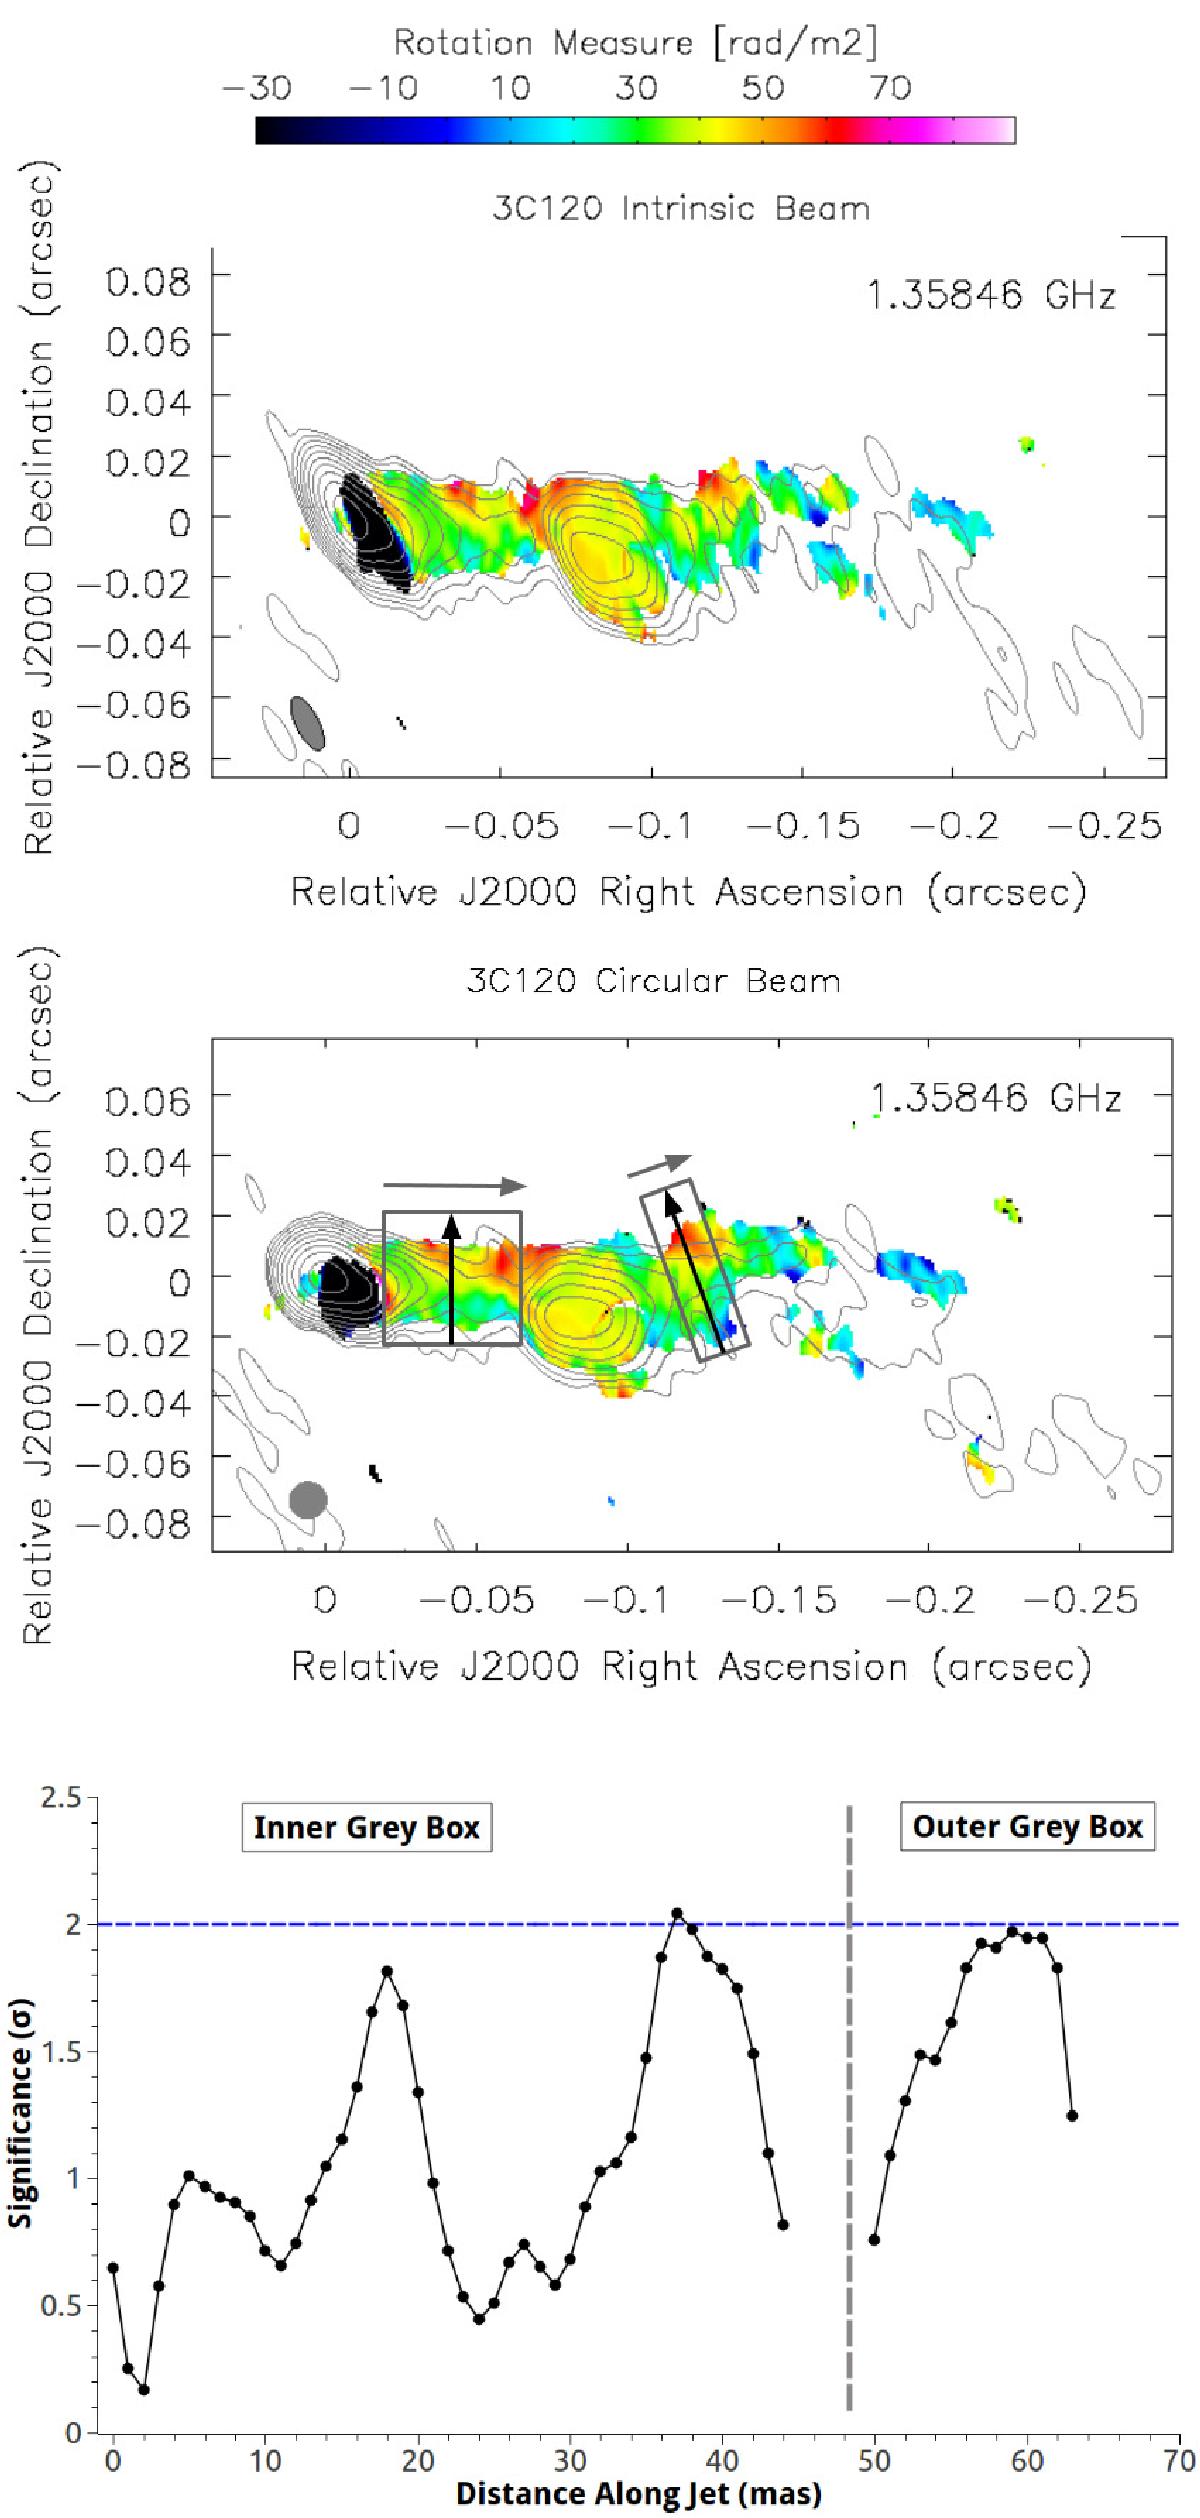
Top panel: intensity map at 1.358 GHz of 3C 120 convolved with the “intrinsic” beam and the RM distribution superposed. The lowest contour is 0.125% of the peak of 1.37 Jy/beam. The middle panel shows the same intensity and RM maps convolved with a circular beam of equal area; the lowest contour is 0.125% of the peak of 1.43 Jy/beam. In both cases, the contour step is a factor of two, the pixel size is 0.25 arcsec, and the beam size is shown in the lower left corner of the image. The bottom panel shows a plot of the significances of a series of transverse RM gradients calculated inside the gray boxes in the middle panel; the 2σ level is shown by the dashed blue horizontal line. See text for more detail.
Current usage metrics show cumulative count of Article Views (full-text article views including HTML views, PDF and ePub downloads, according to the available data) and Abstracts Views on Vision4Press platform.
Data correspond to usage on the plateform after 2015. The current usage metrics is available 48-96 hours after online publication and is updated daily on week days.
Initial download of the metrics may take a while.