Fig. 3
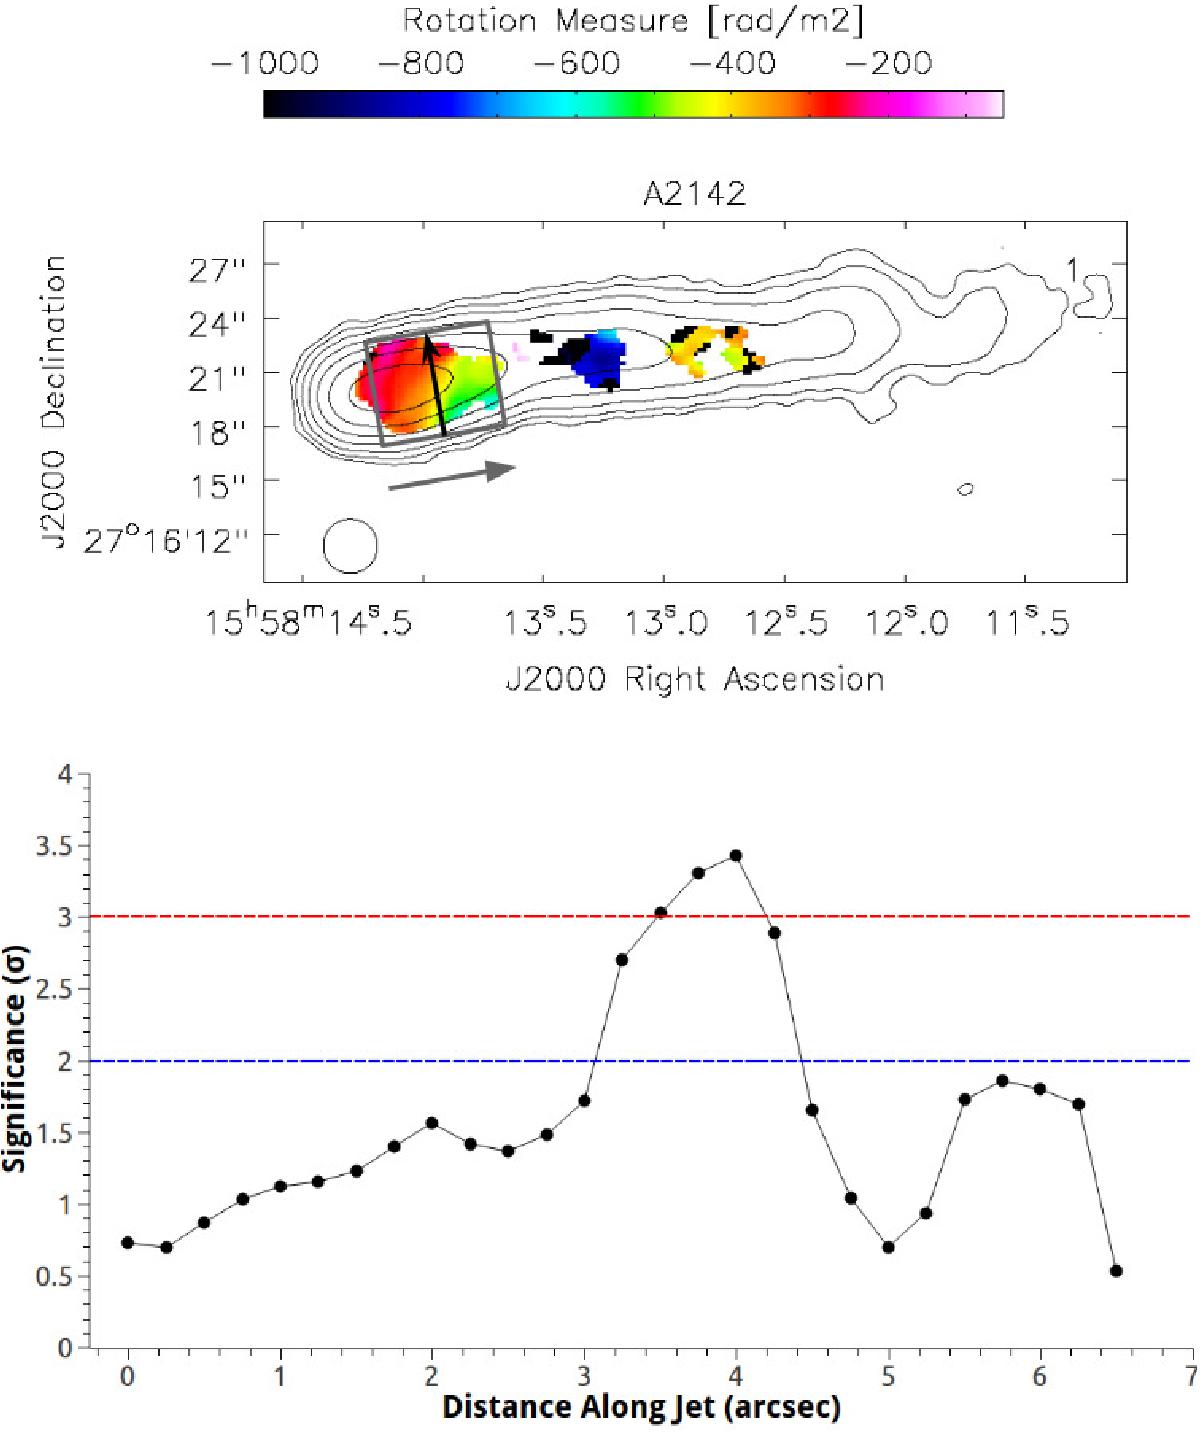
Intensity map at 4.535 GHz of A2142A with the RM distribution superposed (upper panel). The lowest contour is 1% of the peak intensity of 8.8 mJy/beam, the contours increase in increments of a factor of two, and the beam size is shown in the lower left corner of the image. The black arrow across the jet highlights the direction of the transverse RM gradients. The gray box shows the region for which the significances of series of parallel, monotonic transverse RM gradients are plotted in the lower panel; the gray arrow outside the box pointing outward along the jet shows the direction of increasing pixel number in the lower panel, and pixel 0 corresponds to the inner edge of the gray box. Pixel size is 0.25 arcsec. The 2σ level is shown by the dashed blue horizontal line, and the 3σ level by the dashed red horizontal line.
Current usage metrics show cumulative count of Article Views (full-text article views including HTML views, PDF and ePub downloads, according to the available data) and Abstracts Views on Vision4Press platform.
Data correspond to usage on the plateform after 2015. The current usage metrics is available 48-96 hours after online publication and is updated daily on week days.
Initial download of the metrics may take a while.