Fig. 9
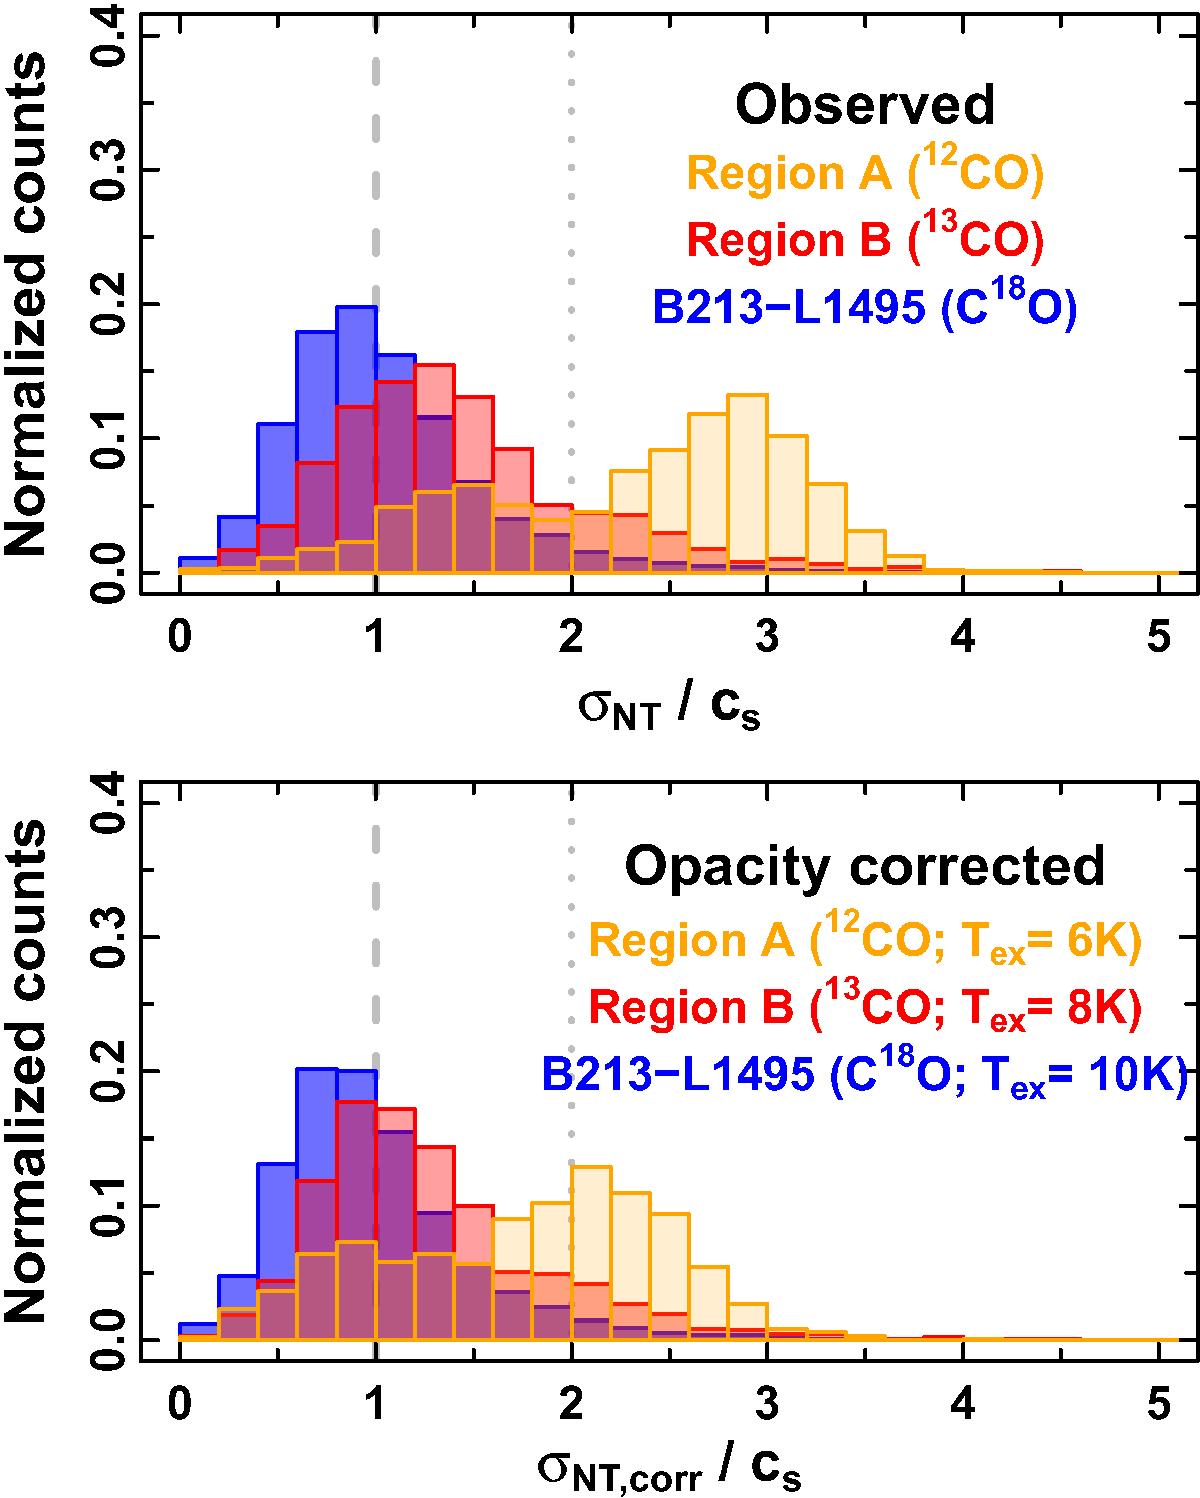
Comparison of the non-thermal velocity dispersions (i.e., σNT in units of the sound speed at 10 K) obtained directly from the observed FWHM (upper panel) and after corrections of the opacity broadening (lower panel) for the three regions studied in Fig. 7: Region A using 12CO (AV ~ 1; >1100 spectra); Region B using 13CO (AV ~ 2; >1100 spectra); and the L1495-B213 filament using C18O (AV> 5; 23 000 spectra Hacar et al. 2013). The opacity corrected values of σNT,corr were obtained from the intrinsic linewidths ΔVint after correcting the observed linewidths using Eqs. (4) and (7). Subthermal excitation values (i.e., Tex = 6 and 8 K) are used for the opacity correction for those points in Regions A and B, in agreement with Goldsmith et al. (2008). Owing to the expected increase of the gas kinetic temperature in the cloud outskirts, the observed values for σNT in Regions A and B correspond to upper limits of the intrinsic velocity dispersion of the gas. Only points with S/N ≤ 3 are considered.
Current usage metrics show cumulative count of Article Views (full-text article views including HTML views, PDF and ePub downloads, according to the available data) and Abstracts Views on Vision4Press platform.
Data correspond to usage on the plateform after 2015. The current usage metrics is available 48-96 hours after online publication and is updated daily on week days.
Initial download of the metrics may take a while.