Fig. 7
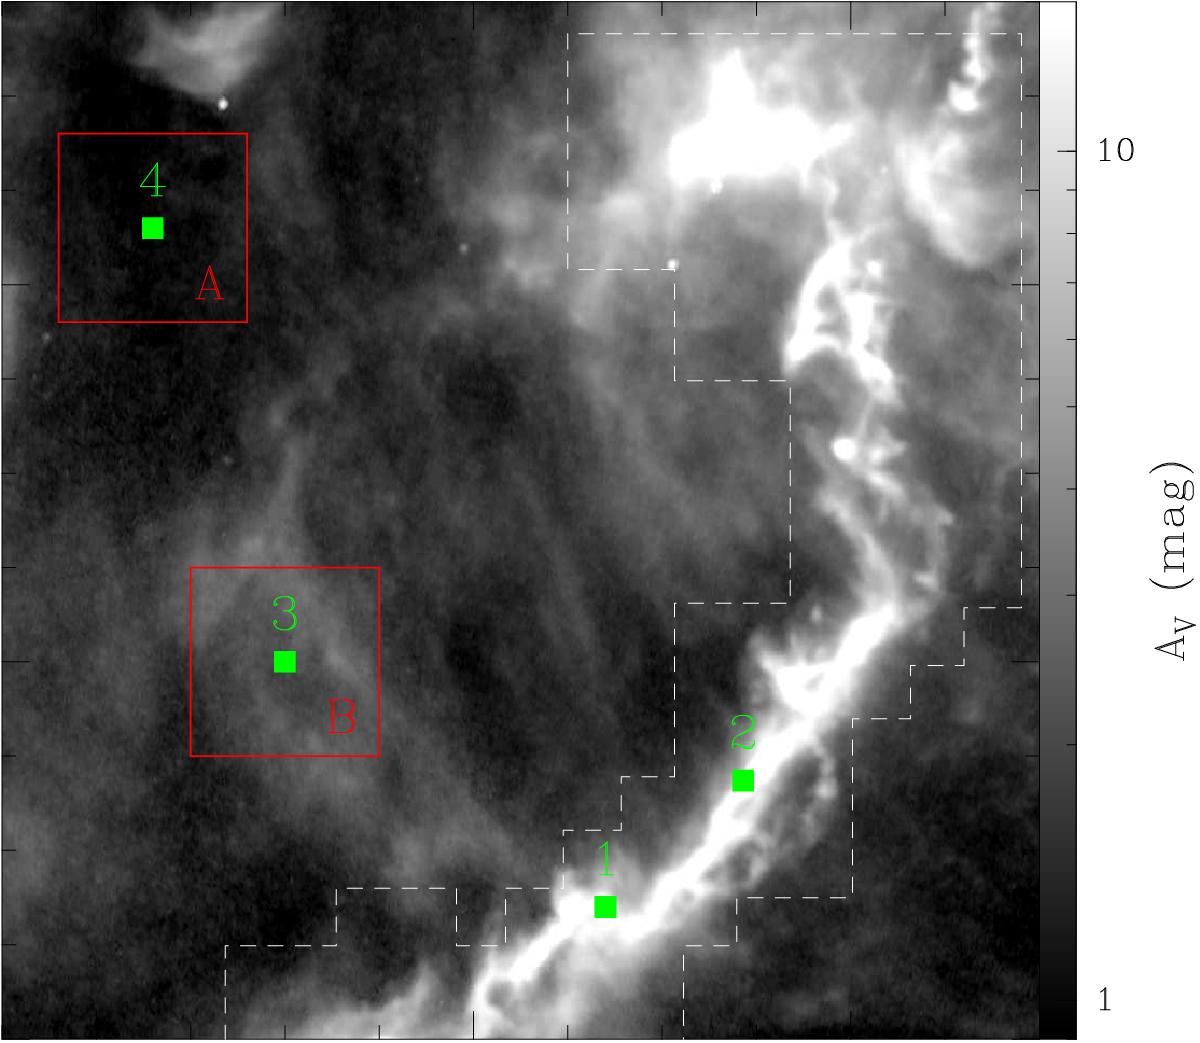
Herschel-continuum total column density map of the northern part of B213-L1495 (Palmeirim et al. 2013). The four positions presented in Fig. 8 are indicated in the map. We note the presence of several prominent large-scale striations at low column densities. The red squares indicate the two sections studied in detail corresponding to representative positions of the Mask 1 (Area A) and Mask 2 (Area B) regions in Goldsmith et al. (2008), respectively. The white dashed line encloses the high column density, C18O-bright region surveyed by Hacar et al. (2013).
Current usage metrics show cumulative count of Article Views (full-text article views including HTML views, PDF and ePub downloads, according to the available data) and Abstracts Views on Vision4Press platform.
Data correspond to usage on the plateform after 2015. The current usage metrics is available 48-96 hours after online publication and is updated daily on week days.
Initial download of the metrics may take a while.