Fig. 2
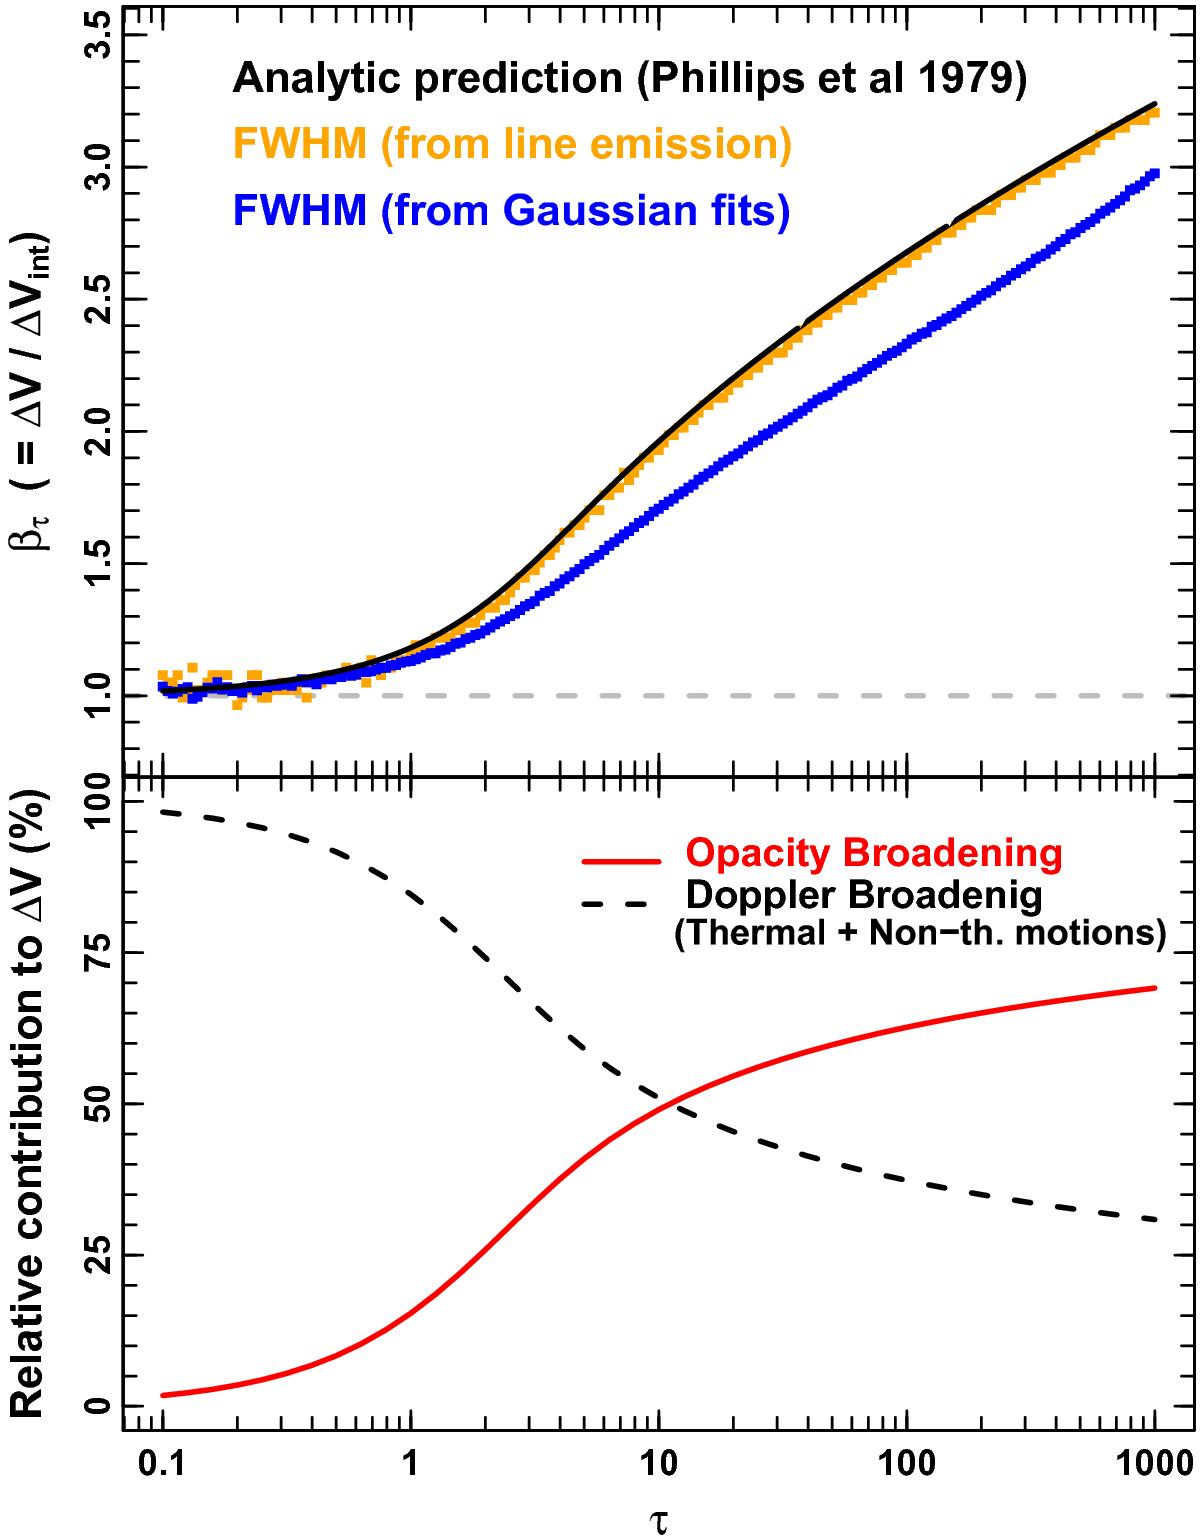
Upper panel: opacity broadening βτ (=ΔV/ ΔVint) as a function of the central opacity of the line τ0 (i.e., curve of growth): (black) analytic prediction (Phillips et al. 1979); (orange) values derived from the observed ΔV directly measured from the line emission; (blue) values derived ΔV from Gaussian fits. Lower panel: contribution of both opacity (red solid line) and intrinsic, Doppler broadening (thermal + non-thermal motions; black dashed line) to the total observed linewidth for different line opacities.
Current usage metrics show cumulative count of Article Views (full-text article views including HTML views, PDF and ePub downloads, according to the available data) and Abstracts Views on Vision4Press platform.
Data correspond to usage on the plateform after 2015. The current usage metrics is available 48-96 hours after online publication and is updated daily on week days.
Initial download of the metrics may take a while.