Fig. 11
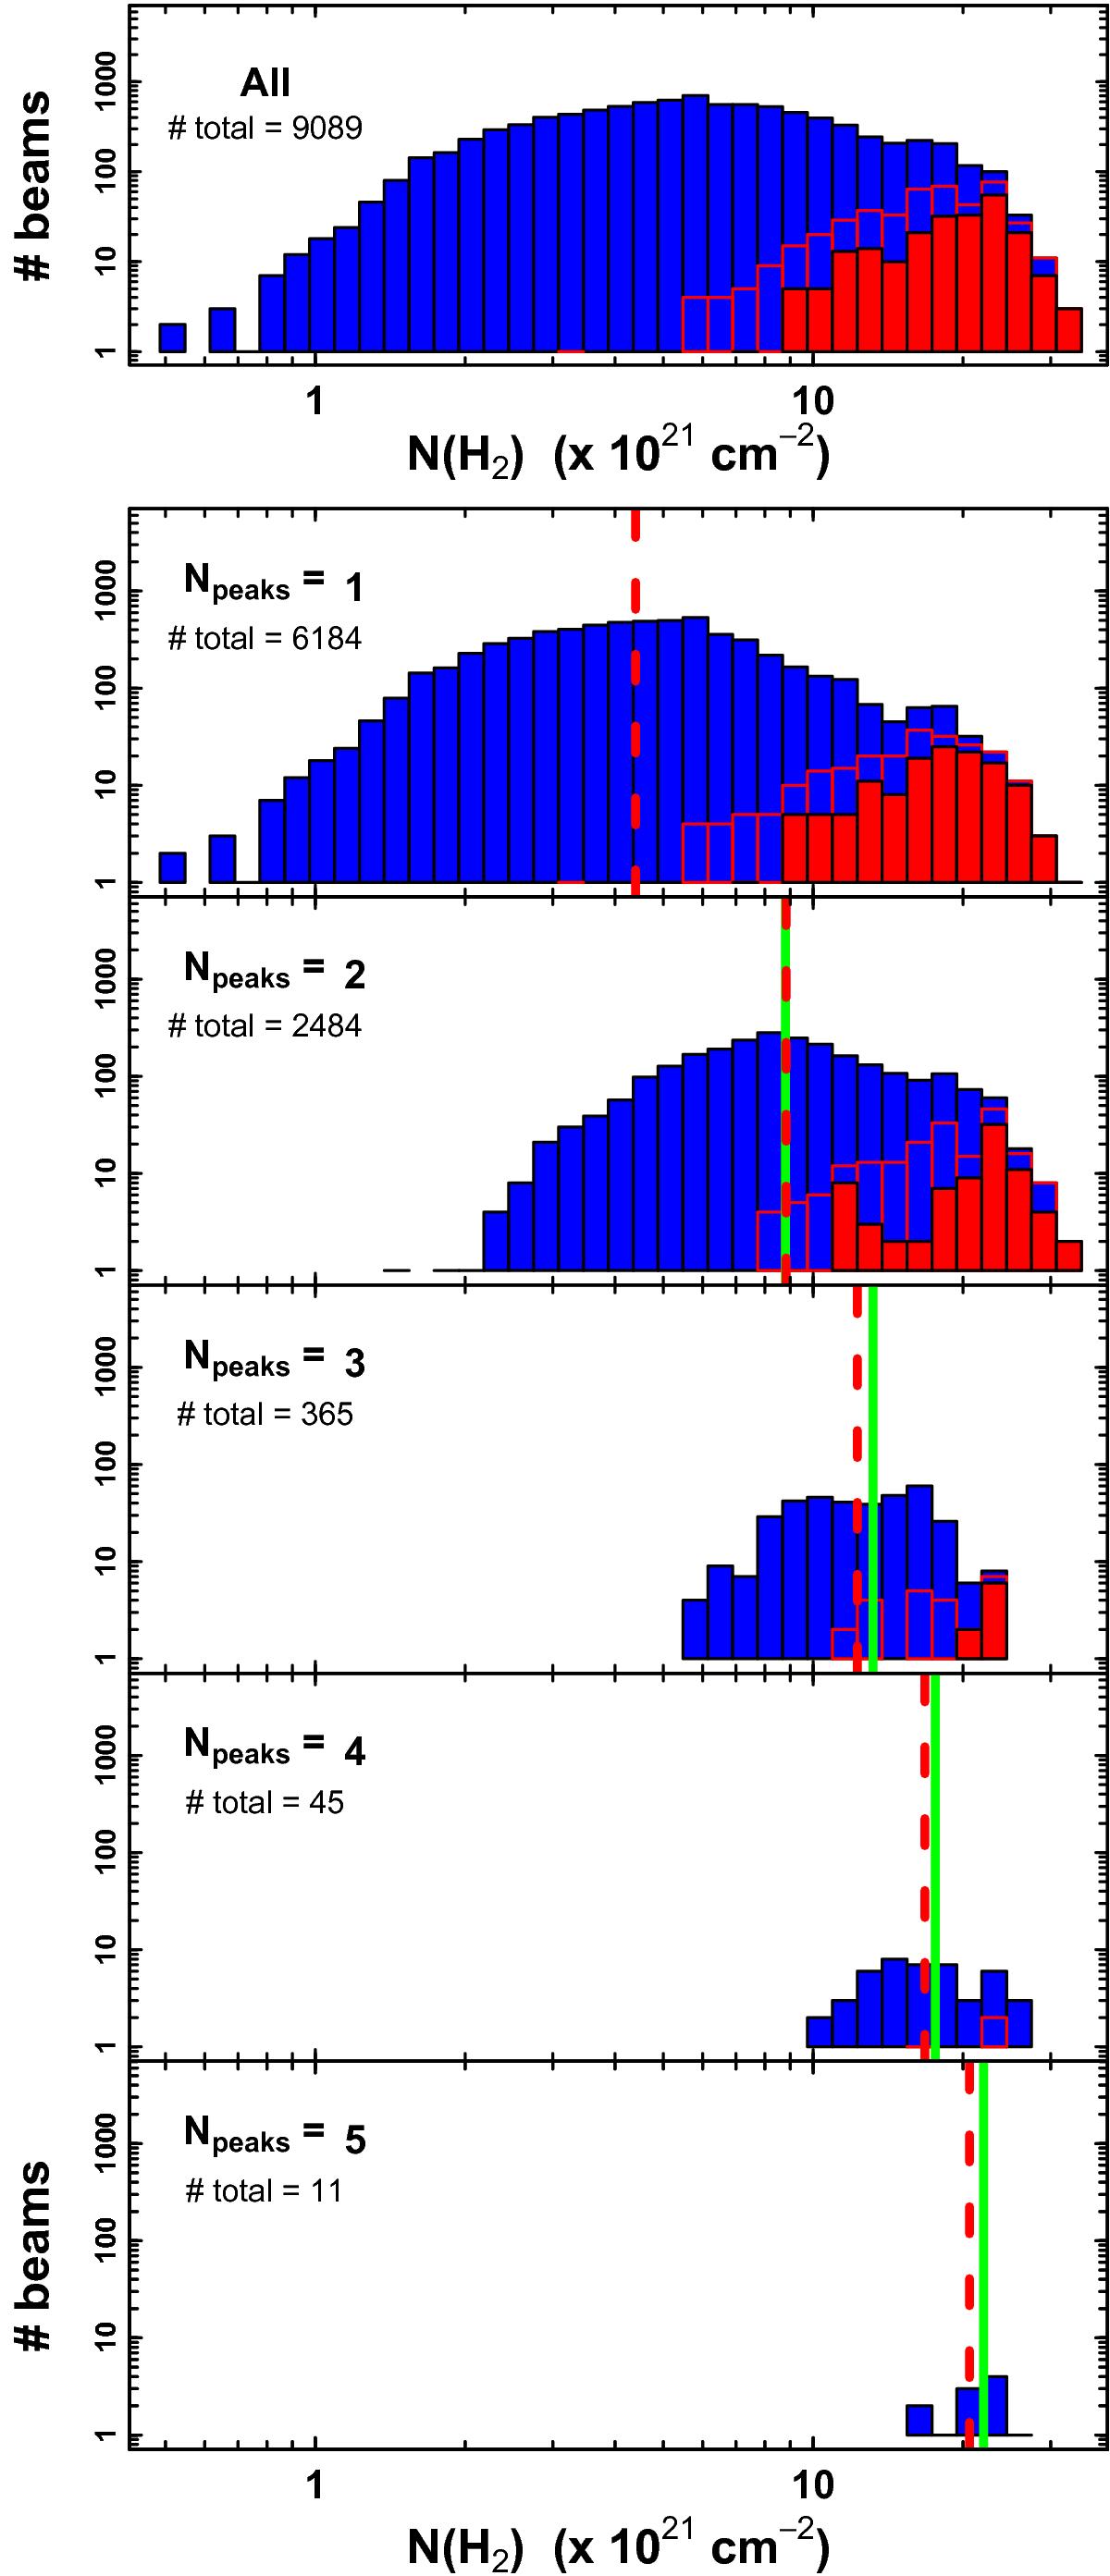
Distributions in log-log space of the total column densities derived from the C18O observations (blue) in the B213-L1495 by Hacar et al. (2013): upper panel: total column densities for all the positions fitted with at least one component with S/N ≥ 3; lower subpanels: corresponding column density distributions for positions with a number of Npeaks = 1 to 5. Those positions containing at least one dense component (S/N(N2H+) ≥ 3; red line bars) and cores (S/N(N2H+) ≥ 6; solid-red bars) are indicated in histograms in the corresponding plots.
Current usage metrics show cumulative count of Article Views (full-text article views including HTML views, PDF and ePub downloads, according to the available data) and Abstracts Views on Vision4Press platform.
Data correspond to usage on the plateform after 2015. The current usage metrics is available 48-96 hours after online publication and is updated daily on week days.
Initial download of the metrics may take a while.