Fig. 10
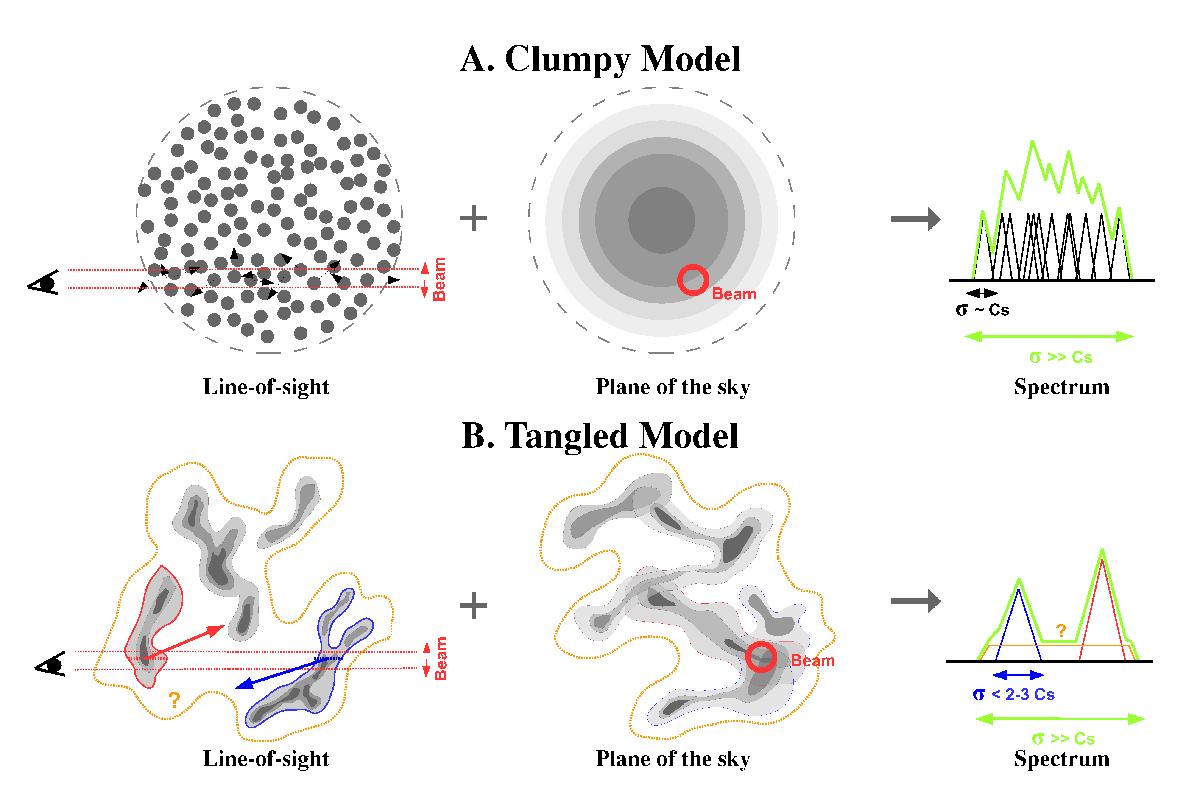
Clumpy (upper panel; inspired by Fig. 4 in Wolfire et al. 1993) and tangled (lower panel) macrotubulent models. The sketches represent the corresponding line of sight (left) and projected (center) views of the cloud, as well as the expected line profiles in the case of optically thin emission (right; e.g., C18O observations). The broadest and highly supersonic linewidths have different origins in these two models. Owing to their large filling factor along the line of sight, they are generated by the accumulation of a high number of sonic-like clumps at different velocities in the classical clumpy models. On the contrary, in the proposed tangled clouds, the linewidths arise from the superposition of few transonic structures correlated at large scales, both spatially and in velocities (i.e., fibers).
Current usage metrics show cumulative count of Article Views (full-text article views including HTML views, PDF and ePub downloads, according to the available data) and Abstracts Views on Vision4Press platform.
Data correspond to usage on the plateform after 2015. The current usage metrics is available 48-96 hours after online publication and is updated daily on week days.
Initial download of the metrics may take a while.