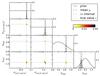
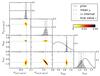
Fig. 2

Results obtained with a two-component scenario for 41 632 (2C1) lines of sight in panel a) and for 4003 (2C2) in panel b). In each panel the top plots of each column show the one-dimensional projection of the posterior and the true value (dotted line), the outcome of the analysis (dashed and dash-dotted lines), and the prior (continuous line). The panels in color show the two-dimensional marginalized views of the posterior as sampled.
Current usage metrics show cumulative count of Article Views (full-text article views including HTML views, PDF and ePub downloads, according to the available data) and Abstracts Views on Vision4Press platform.
Data correspond to usage on the plateform after 2015. The current usage metrics is available 48-96 hours after online publication and is updated daily on week days.
Initial download of the metrics may take a while.