Fig. 4
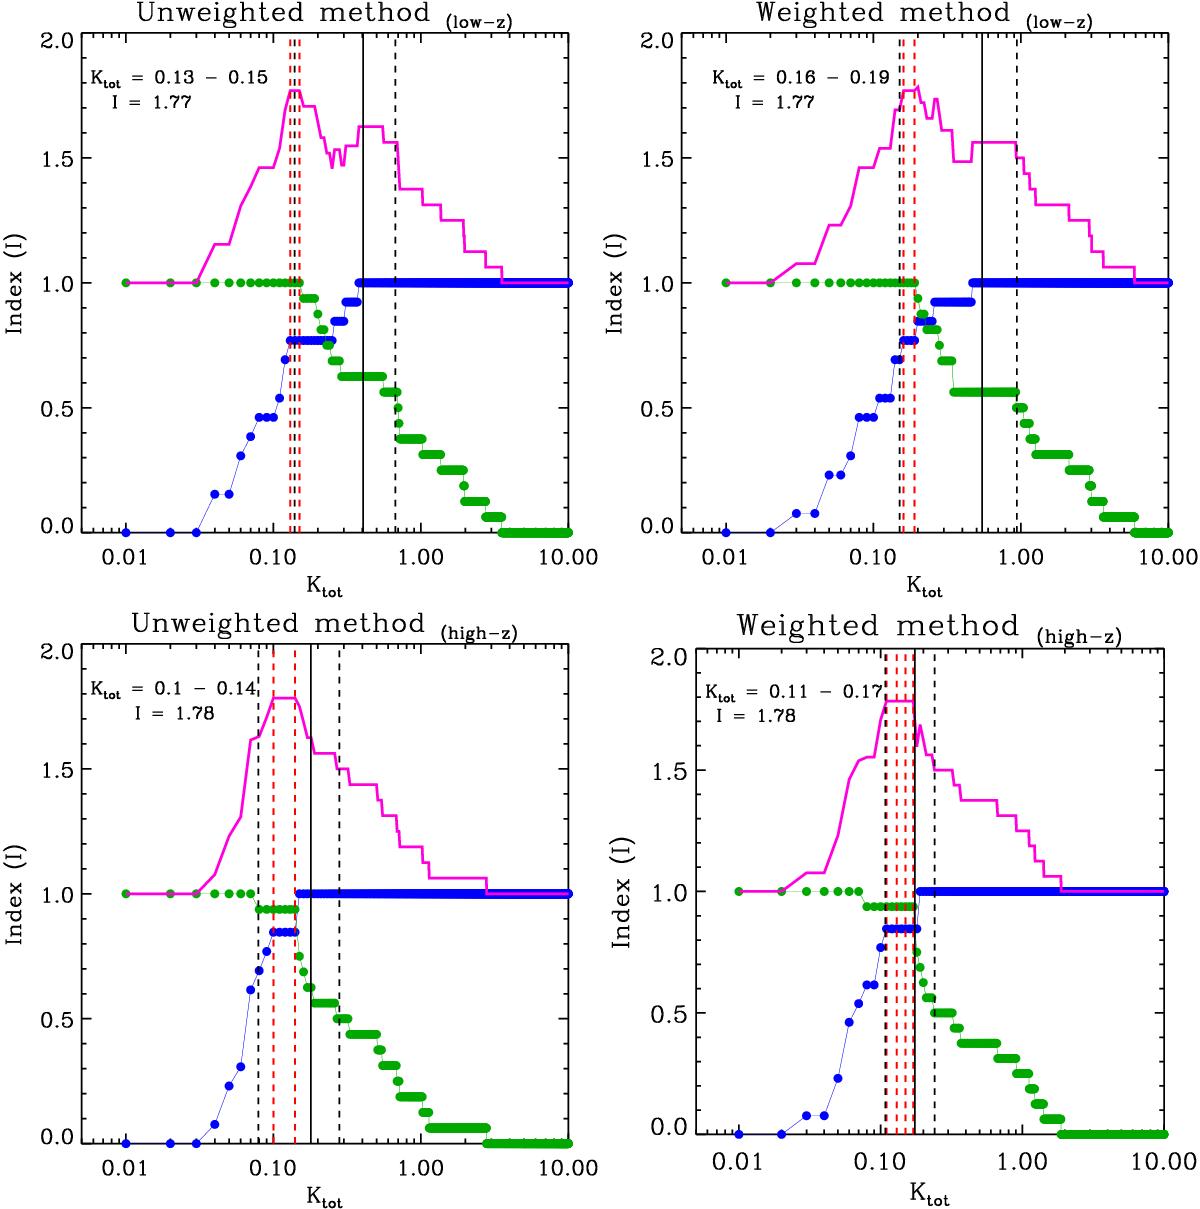
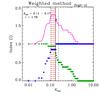
Distribution of the total number of well-classified galaxies, where I (magenta) equals the sum of Idisk (blue) and Imerger (green), at low- (upper panels) and at high-z (bottom panels) as a function of the total kinematic asymmetry Ktot in the unweighted (left) and weighted (right) planes when assuming that only the isolated disks are considered “true disks” and ongoing and post-coalescence mergers are considered “true mergers”. The red dashed lines represent the “optimal” frontiers, which give us the Ktot values for which the maximum index I is derived; the solid black line indicates the ![]() value derived according to Eq. (5), while the two dashed black lines represent the statistical frontiers (
value derived according to Eq. (5), while the two dashed black lines represent the statistical frontiers (![]() MAD).
MAD).
Current usage metrics show cumulative count of Article Views (full-text article views including HTML views, PDF and ePub downloads, according to the available data) and Abstracts Views on Vision4Press platform.
Data correspond to usage on the plateform after 2015. The current usage metrics is available 48-96 hours after online publication and is updated daily on week days.
Initial download of the metrics may take a while.