Fig. 3
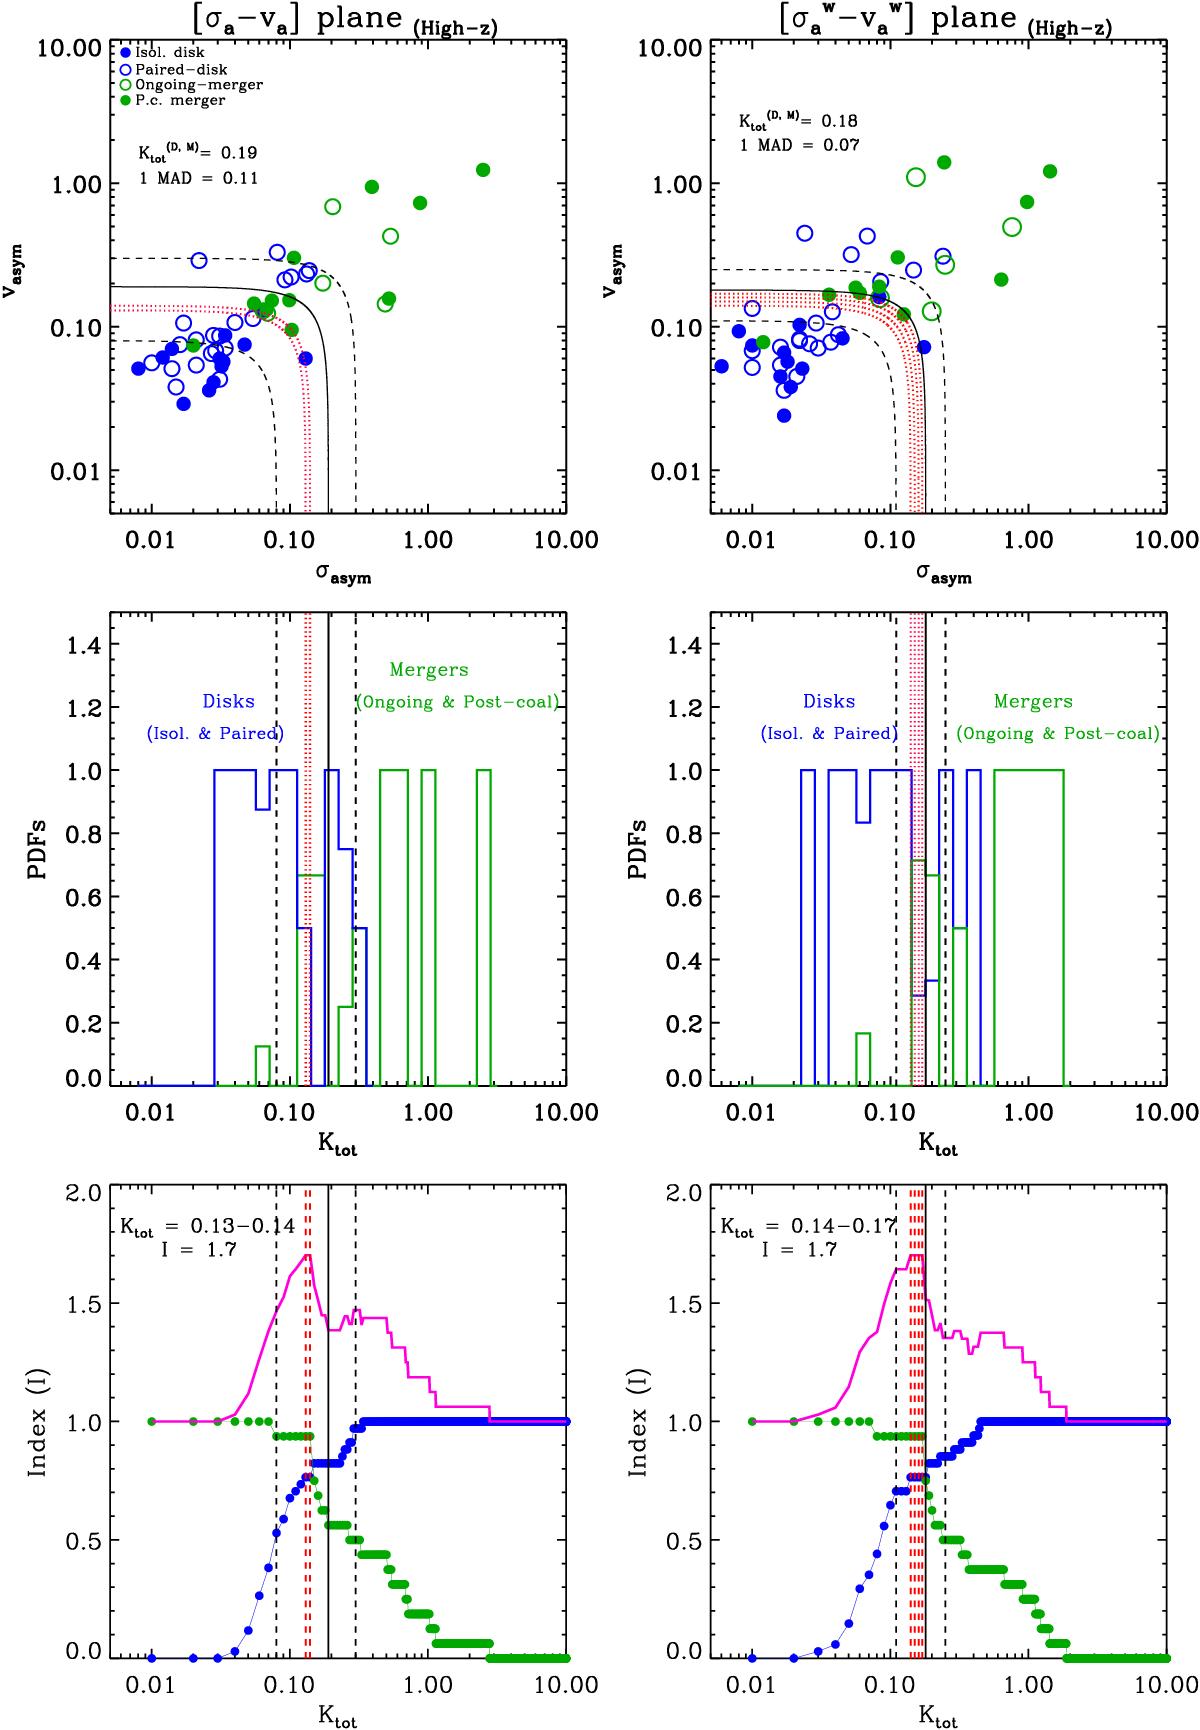
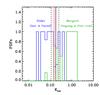
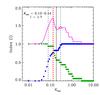
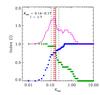
Results in the (σa-va) and (![]() -
-![]() ) planes for the whole sample simulated at z = 3. The panels and symbols are the same as those shown in Fig. 2. In all the panels we represent the following lines: red dashed lines represent the “optimal” frontiers, which give us the Ktot values for which the maximum index I is derived; the solid black line indicates the
) planes for the whole sample simulated at z = 3. The panels and symbols are the same as those shown in Fig. 2. In all the panels we represent the following lines: red dashed lines represent the “optimal” frontiers, which give us the Ktot values for which the maximum index I is derived; the solid black line indicates the ![]() value derived according to Eq. (5), while the two dashed black lines represent the statistical frontiers (
value derived according to Eq. (5), while the two dashed black lines represent the statistical frontiers (![]() MAD).
MAD).
Current usage metrics show cumulative count of Article Views (full-text article views including HTML views, PDF and ePub downloads, according to the available data) and Abstracts Views on Vision4Press platform.
Data correspond to usage on the plateform after 2015. The current usage metrics is available 48-96 hours after online publication and is updated daily on week days.
Initial download of the metrics may take a while.