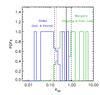
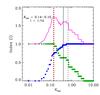
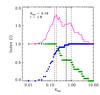
Fig. 2
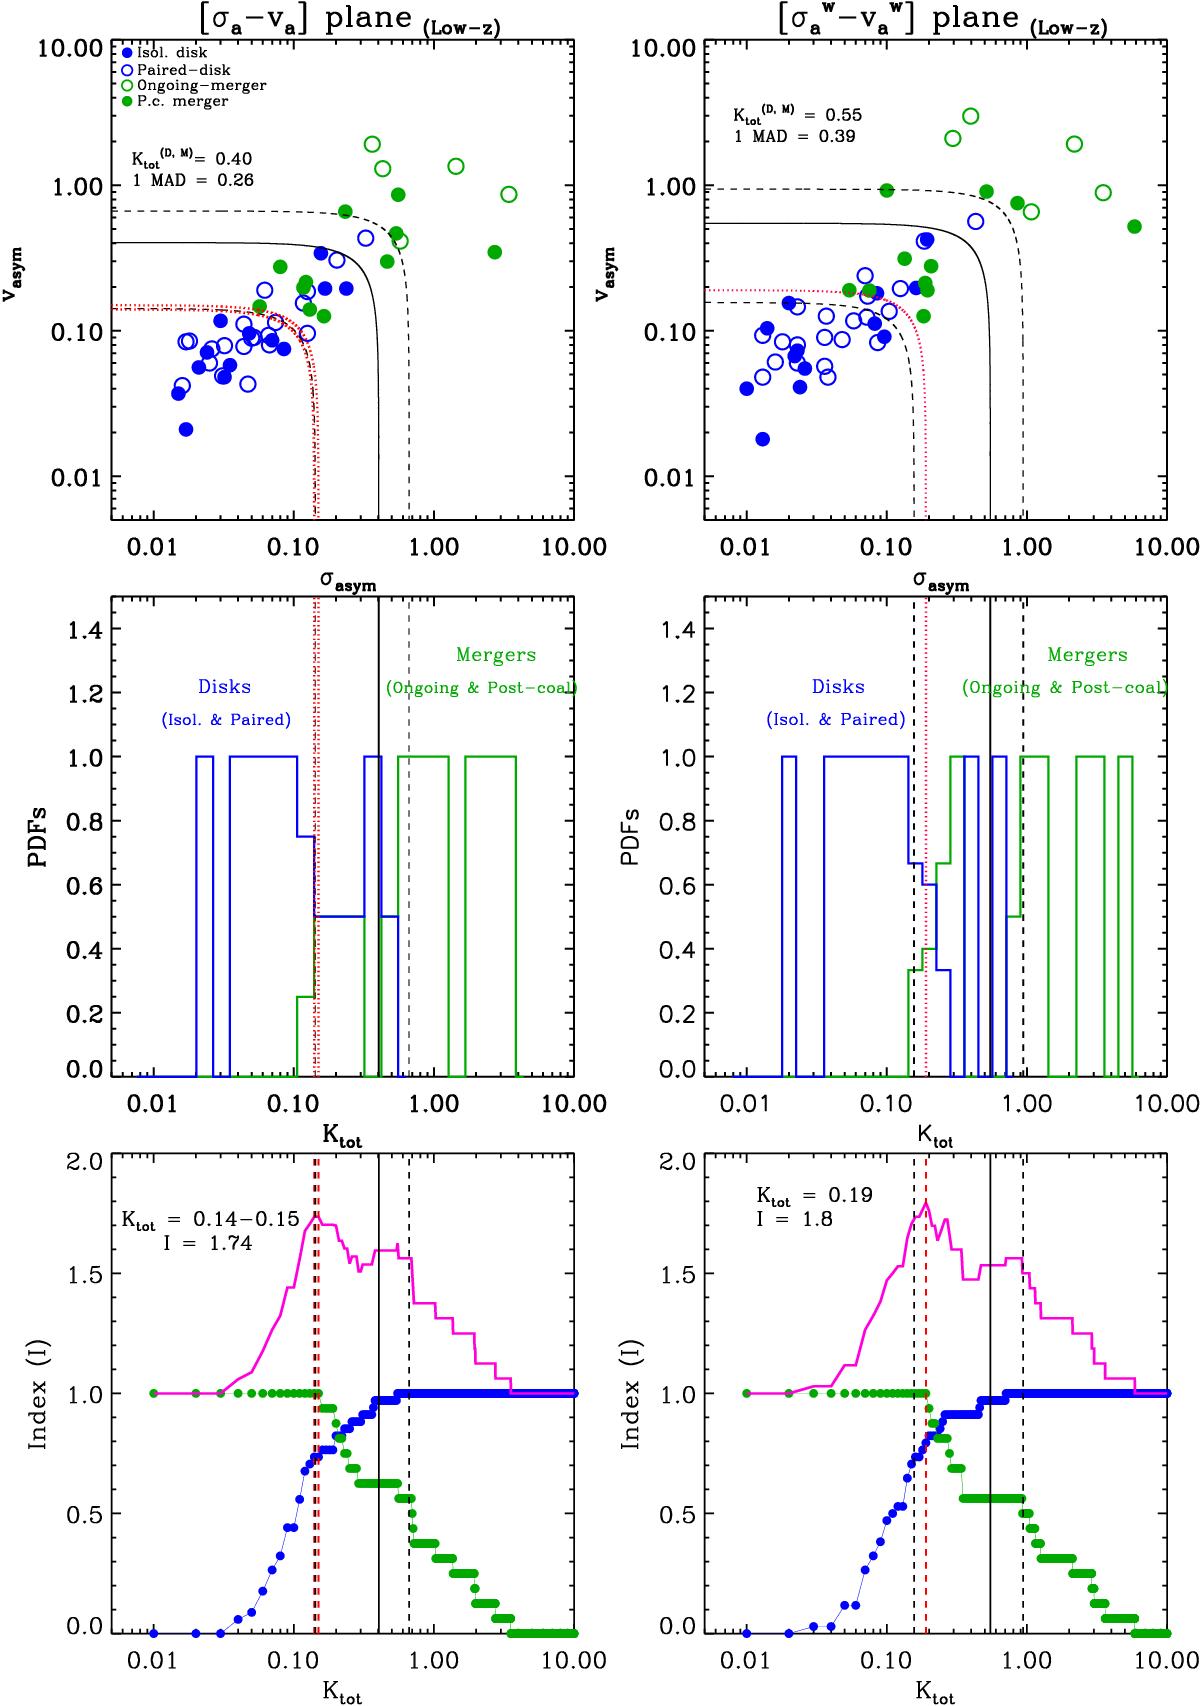
Top: asymmetry measure of the velocity vasym and velocity dispersion σasym fields for the whole sample observed at low-z when applying the unweighted (left) or the weighted (right) methods. Different colors distinguish the different morphological types: the solid dark blue dots are the morphologically classified isolated disks, the wide pairs are in open blue dots, the post-coalescence mergers are in solid dark green dots, and the close-pairs are in open green dots. Middle: probability distribution functions (PDFs) of the respective planes normalized to the number of objects in each bin. Bottom: distribution of the total number of well classified galaxies at low-z as a function of the total kinematic asymmetry Ktot in the unweighted (left) and weighted (right) planes. In all the panels we represent the following lines: the red dashed line(s) represents the “optimal” frontier, which gives us the Ktot value for which the maximum index I is derived; the solid black line indicates the ![]() value derived according to Eq. (5) , while the two dashed black lines represent the statistical frontiers (
value derived according to Eq. (5) , while the two dashed black lines represent the statistical frontiers (![]() MAD).
MAD).
Current usage metrics show cumulative count of Article Views (full-text article views including HTML views, PDF and ePub downloads, according to the available data) and Abstracts Views on Vision4Press platform.
Data correspond to usage on the plateform after 2015. The current usage metrics is available 48-96 hours after online publication and is updated daily on week days.
Initial download of the metrics may take a while.