Fig. 1
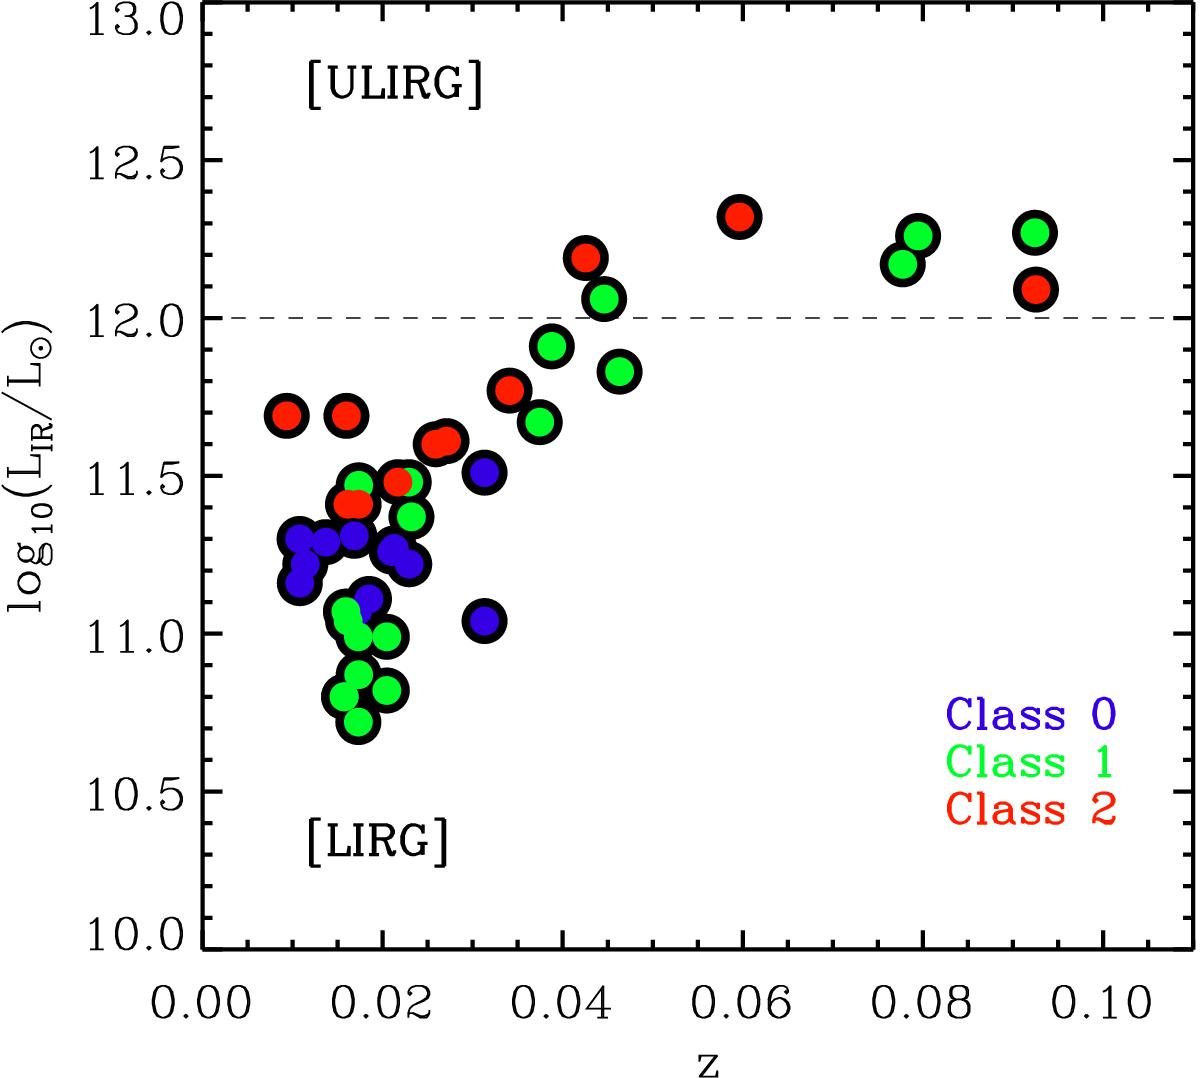
Distribution of the VIMOS sample in the infrared luminosity–redshift plane. The different colors represent the three stages of interactions: we show the “Class 0” single isolated objects in blue, the “Class 1” interacting galaxies in a pre-coalescence phase in green, and the “Class 2” objects representing single systems with evidence of having suffered a merger (post-coalescence phase) in red. The horizontal dashed line separates the LIRG and ULIRG domains.
Current usage metrics show cumulative count of Article Views (full-text article views including HTML views, PDF and ePub downloads, according to the available data) and Abstracts Views on Vision4Press platform.
Data correspond to usage on the plateform after 2015. The current usage metrics is available 48-96 hours after online publication and is updated daily on week days.
Initial download of the metrics may take a while.