Fig. 3
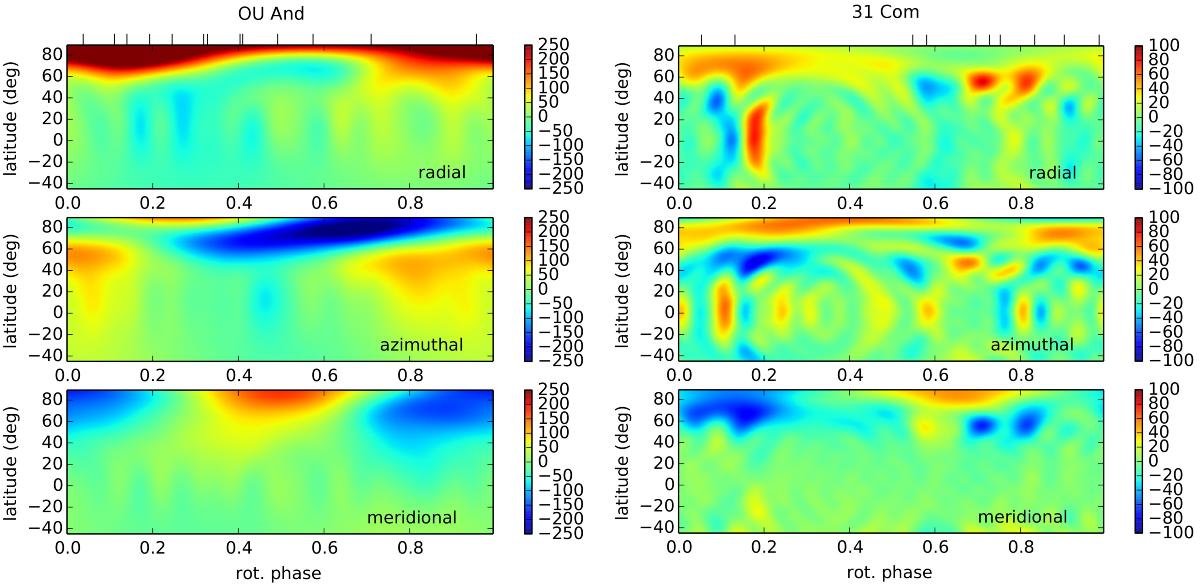
Photospheric magnetic maps of OU And (left) and 31 Com (right) in 2013. For each star, the vectorial magnetic field is split in its three components in spherical projection and ℓmax = 20. The color scale illustrates the field strength in Gauss, and the rotational phases of our data sets show up as vertical ticks on top of each map.
Current usage metrics show cumulative count of Article Views (full-text article views including HTML views, PDF and ePub downloads, according to the available data) and Abstracts Views on Vision4Press platform.
Data correspond to usage on the plateform after 2015. The current usage metrics is available 48-96 hours after online publication and is updated daily on week days.
Initial download of the metrics may take a while.