Fig. 2
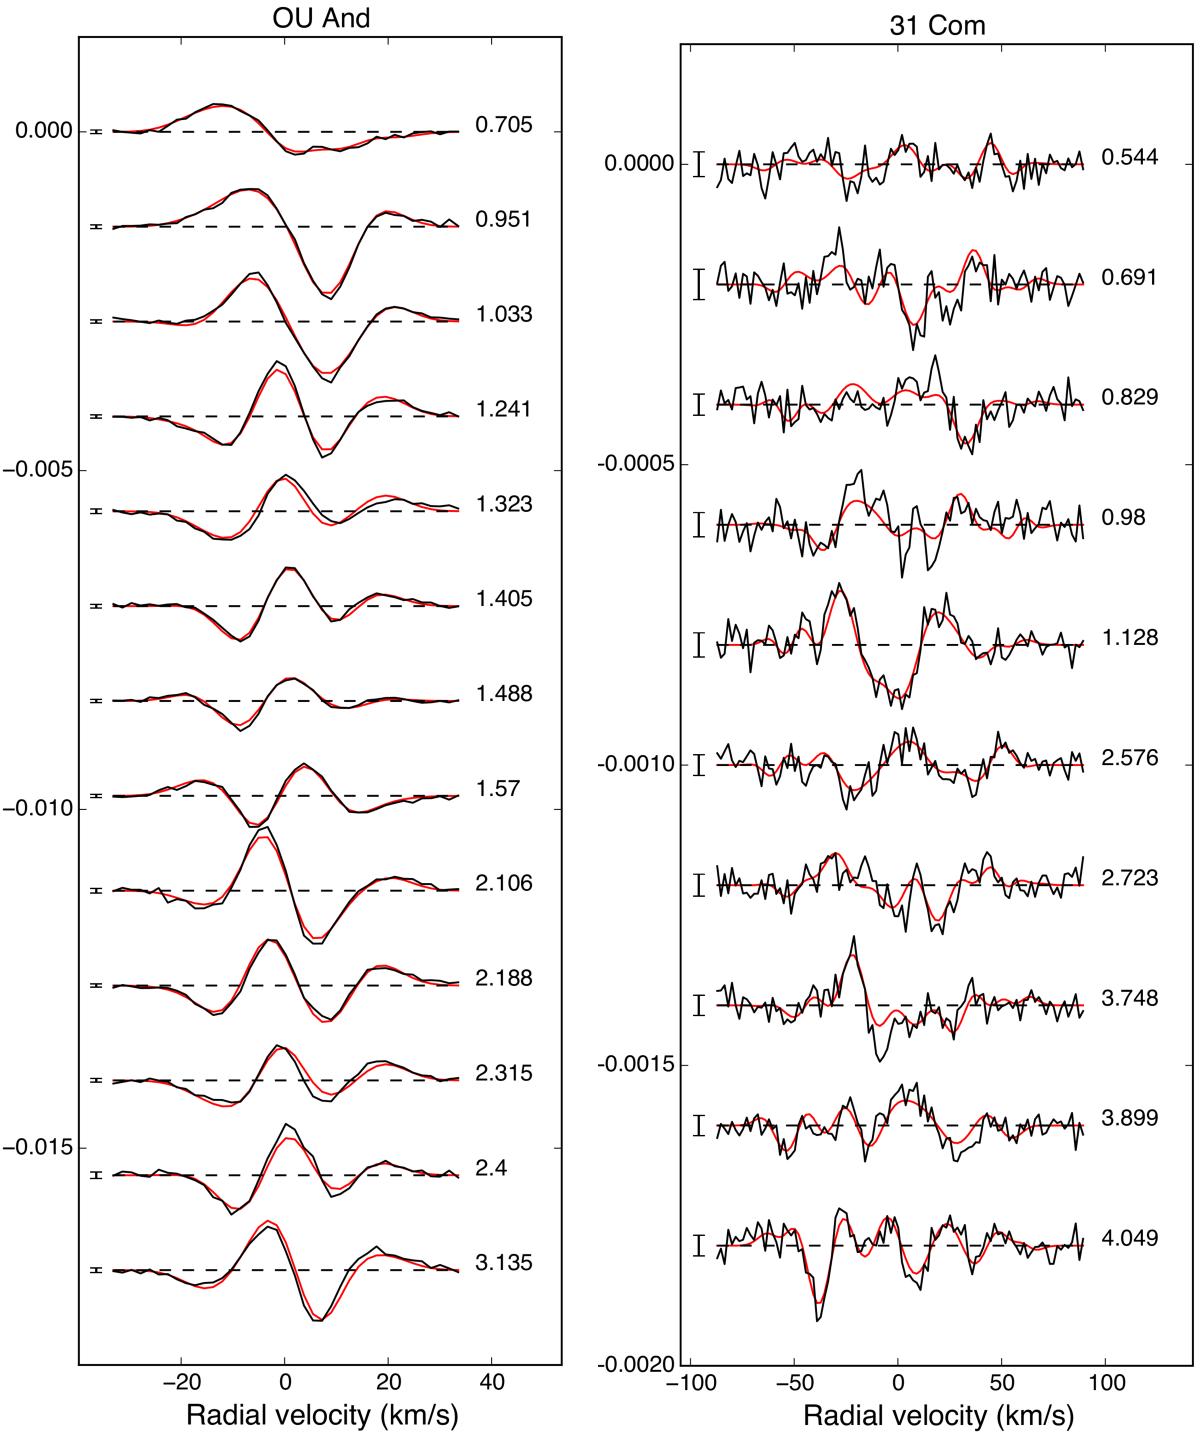
Observed Stokes V LSD profiles (black line) and profiles produced by our best ZDI model (red lines) for OU And (left) and 31 Comae (right). Successive profiles are vertically shifted (from top to bottom) for display clarity. The rotational phase of each observation (computed from the ephemeris given in the text) is listed to the right, with the integer part denoting the rotational cycle since the start of the observing run. Error bars are illustrated on the left of every profile and dashed lines illustrate the zero level.
Current usage metrics show cumulative count of Article Views (full-text article views including HTML views, PDF and ePub downloads, according to the available data) and Abstracts Views on Vision4Press platform.
Data correspond to usage on the plateform after 2015. The current usage metrics is available 48-96 hours after online publication and is updated daily on week days.
Initial download of the metrics may take a while.