Free Access
Fig. A.1
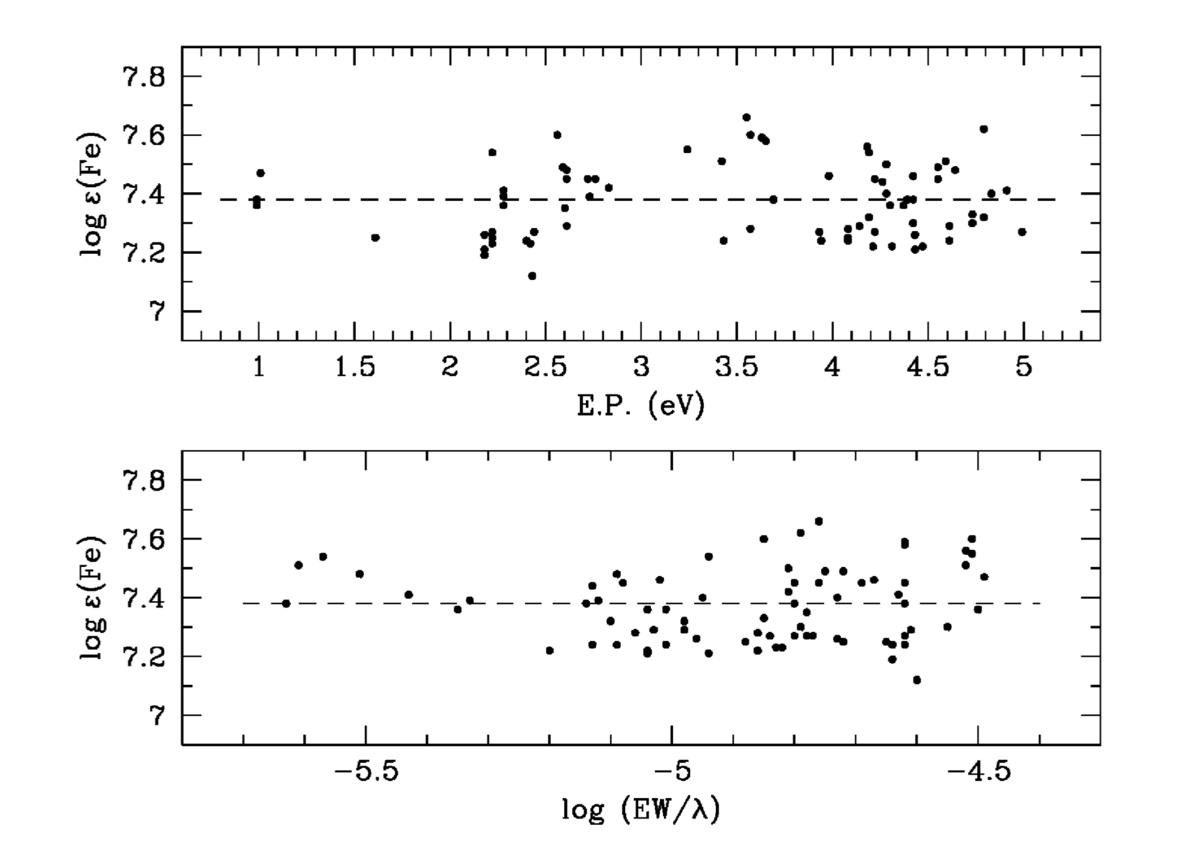
Abundance of Fe i lines versus excitation potential. The correct temperature is indicated by a zero slope in this plot. Bottom: abundance of Fe i lines versus showing determination of the microturbulent velocity.
Current usage metrics show cumulative count of Article Views (full-text article views including HTML views, PDF and ePub downloads, according to the available data) and Abstracts Views on Vision4Press platform.
Data correspond to usage on the plateform after 2015. The current usage metrics is available 48-96 hours after online publication and is updated daily on week days.
Initial download of the metrics may take a while.