Fig. 10
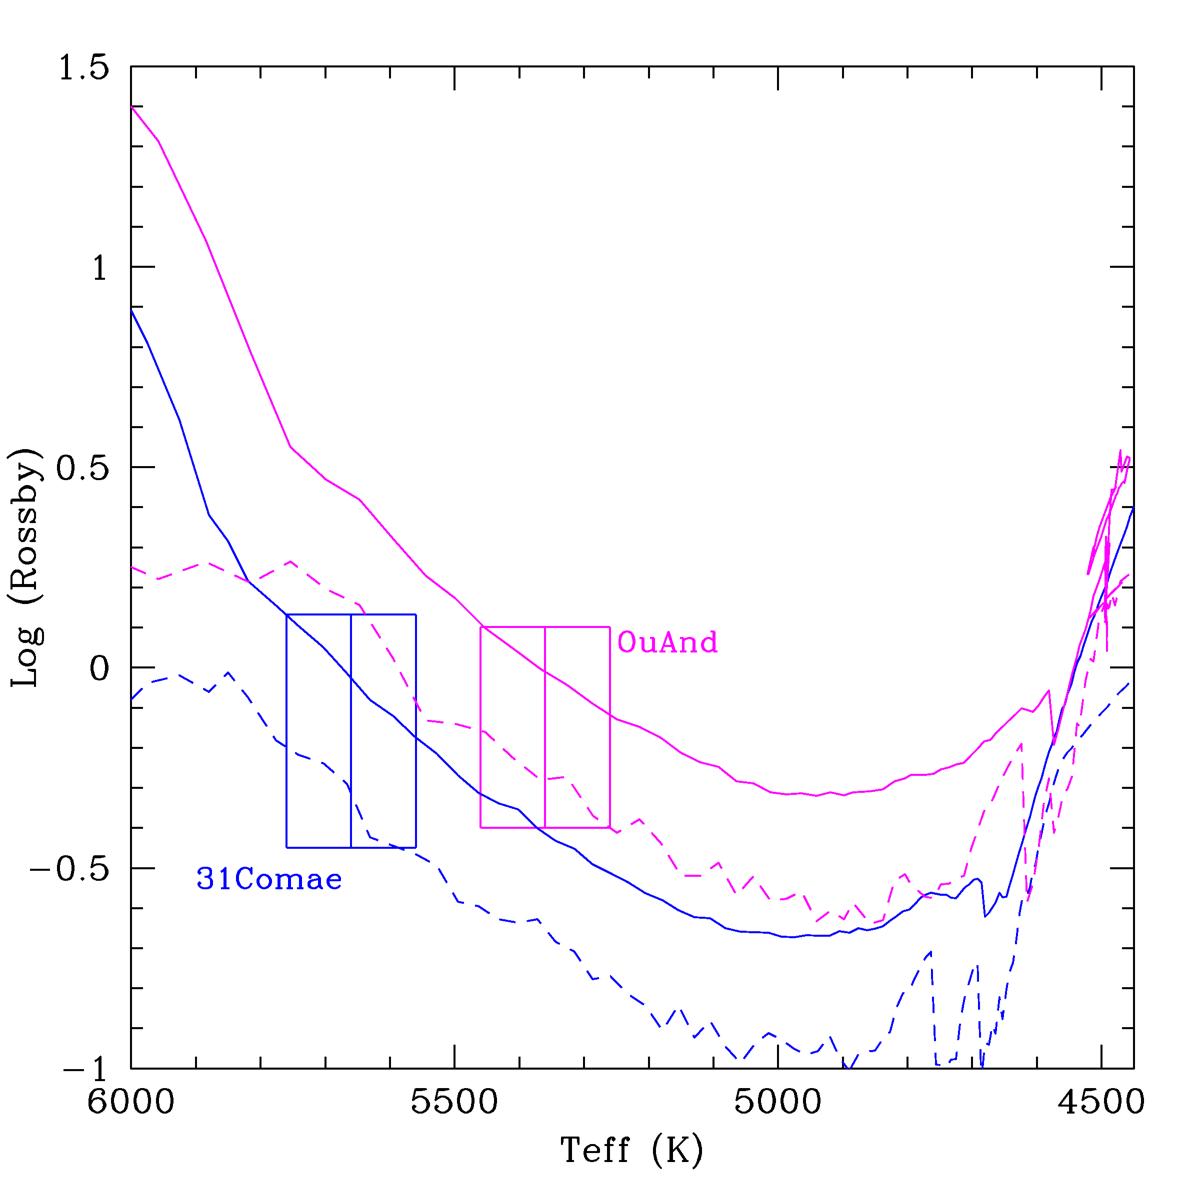
Evolution of the theoretical Rossby number for the 2.7 and 2.85 M⊙ dedicated models (blue and magenta respectively). The full and dotted lines correspond to Rossby numbers computed with the turnover timescale taken, respectively, at half a pressure scale height above the base of the convective envelope and at its maximum value within the convective envelope. The rectangles correspond to the expected position of 31 Com and OU And, taking into account uncertainties in their effective temperatures.
Current usage metrics show cumulative count of Article Views (full-text article views including HTML views, PDF and ePub downloads, according to the available data) and Abstracts Views on Vision4Press platform.
Data correspond to usage on the plateform after 2015. The current usage metrics is available 48-96 hours after online publication and is updated daily on week days.
Initial download of the metrics may take a while.