Free Access
Fig. 4
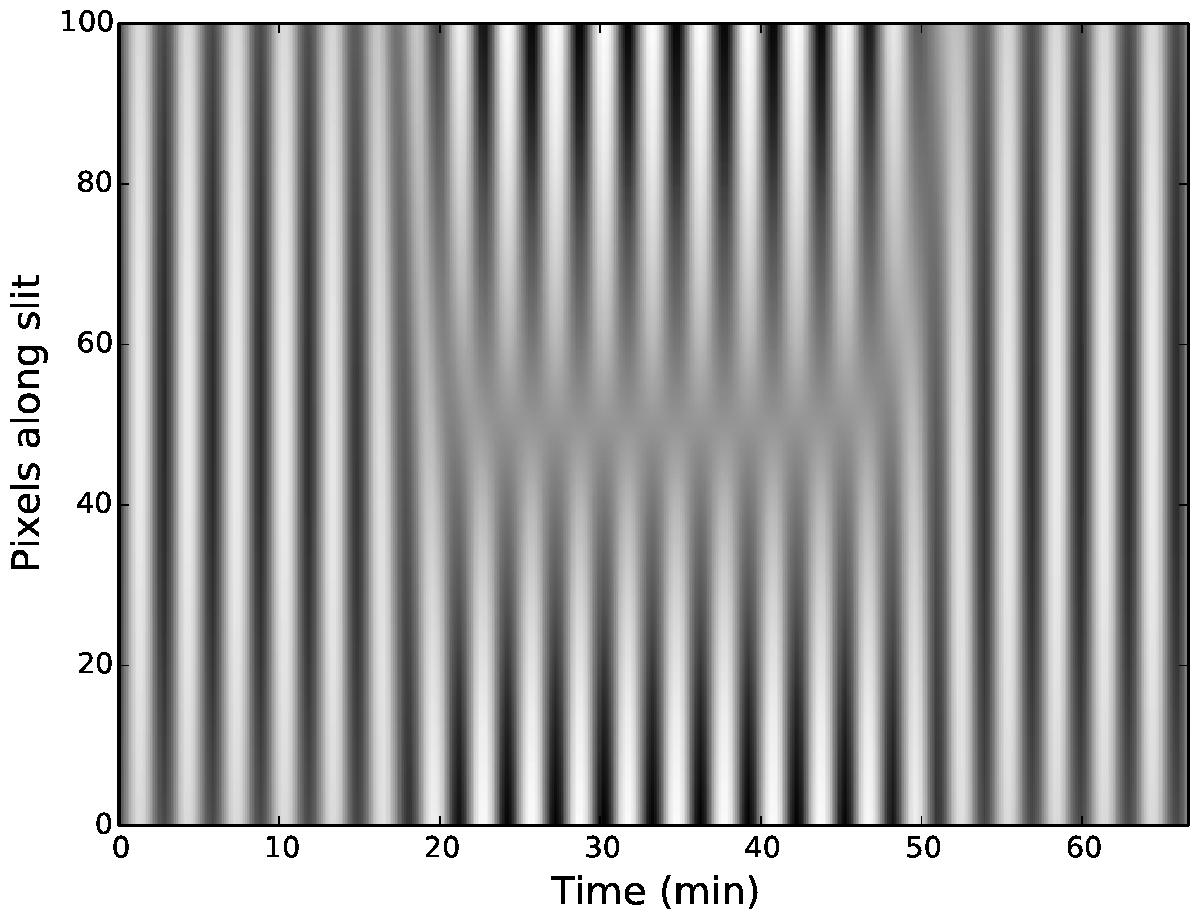
Sausage wave is substituted by a kink wave at minute 21. From then on the vortex line of dislocations is seen until at minute 48 the kink wave gives way to another sausage wave. The sequence reproduces the main dislocation line of Fig. 1, including the upwards shift of the line near its extremes.
Current usage metrics show cumulative count of Article Views (full-text article views including HTML views, PDF and ePub downloads, according to the available data) and Abstracts Views on Vision4Press platform.
Data correspond to usage on the plateform after 2015. The current usage metrics is available 48-96 hours after online publication and is updated daily on week days.
Initial download of the metrics may take a while.