Fig. 1
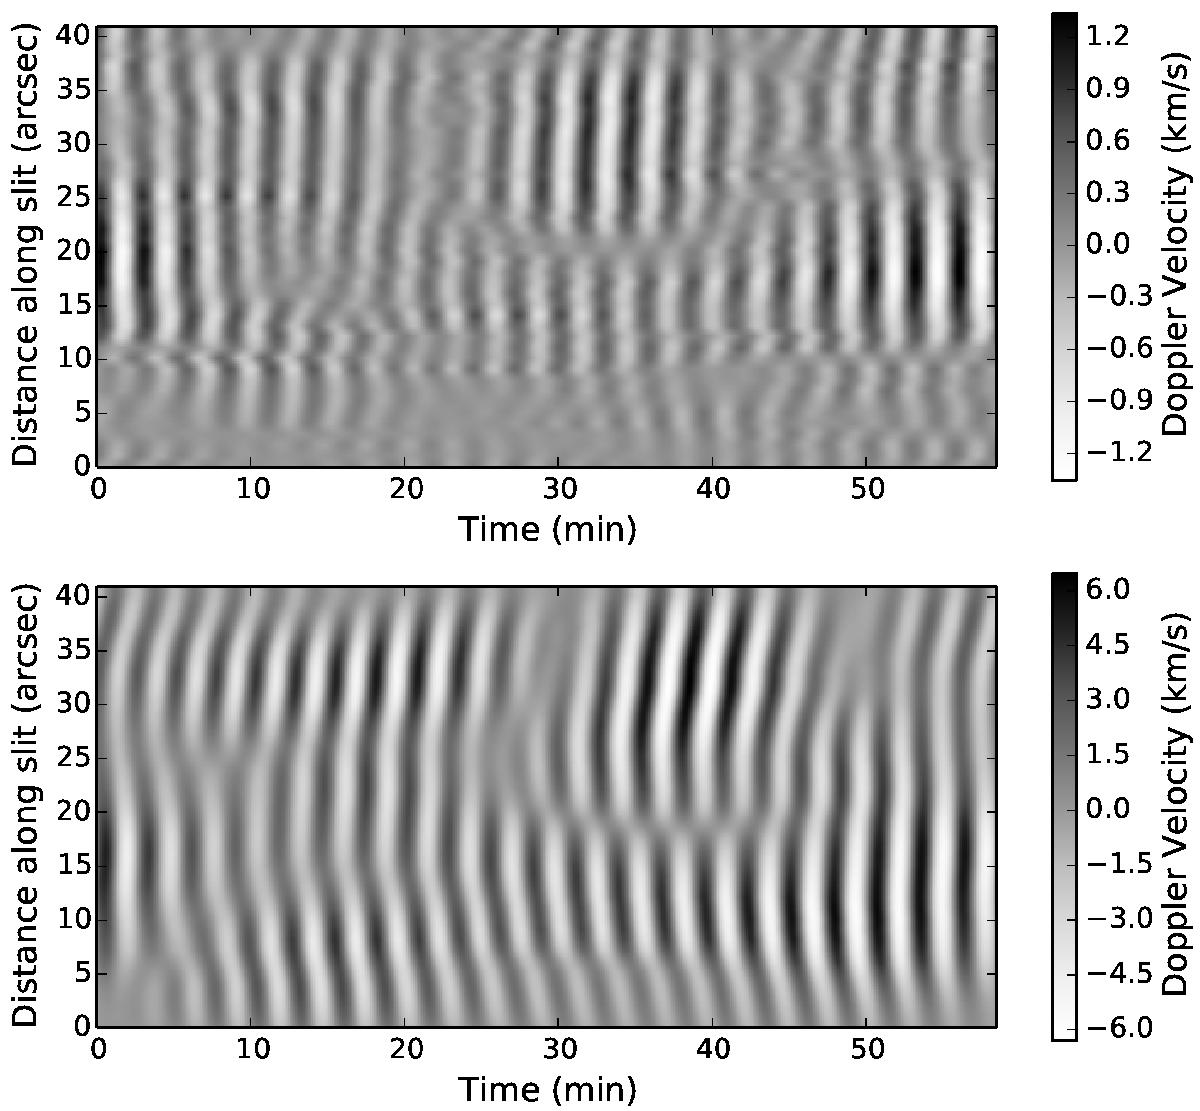
Observation of waves in the Si I line formed in the photosphere (top) and the He I line formed in a chromosphere (bottom). The images show a time series of Doppler velocities along the line of sight measured in the two spectral lines along a spectrograph slit placed across the umbra of a sunspot (NOAA9176) observed by the VTT on October 1, 2000 at latitude 10°S and heliocentric longitude 19°W. The measured velocities have been Fourier-filtered to show only the waves in the range of 3-min period.
Current usage metrics show cumulative count of Article Views (full-text article views including HTML views, PDF and ePub downloads, according to the available data) and Abstracts Views on Vision4Press platform.
Data correspond to usage on the plateform after 2015. The current usage metrics is available 48-96 hours after online publication and is updated daily on week days.
Initial download of the metrics may take a while.