Fig. 7

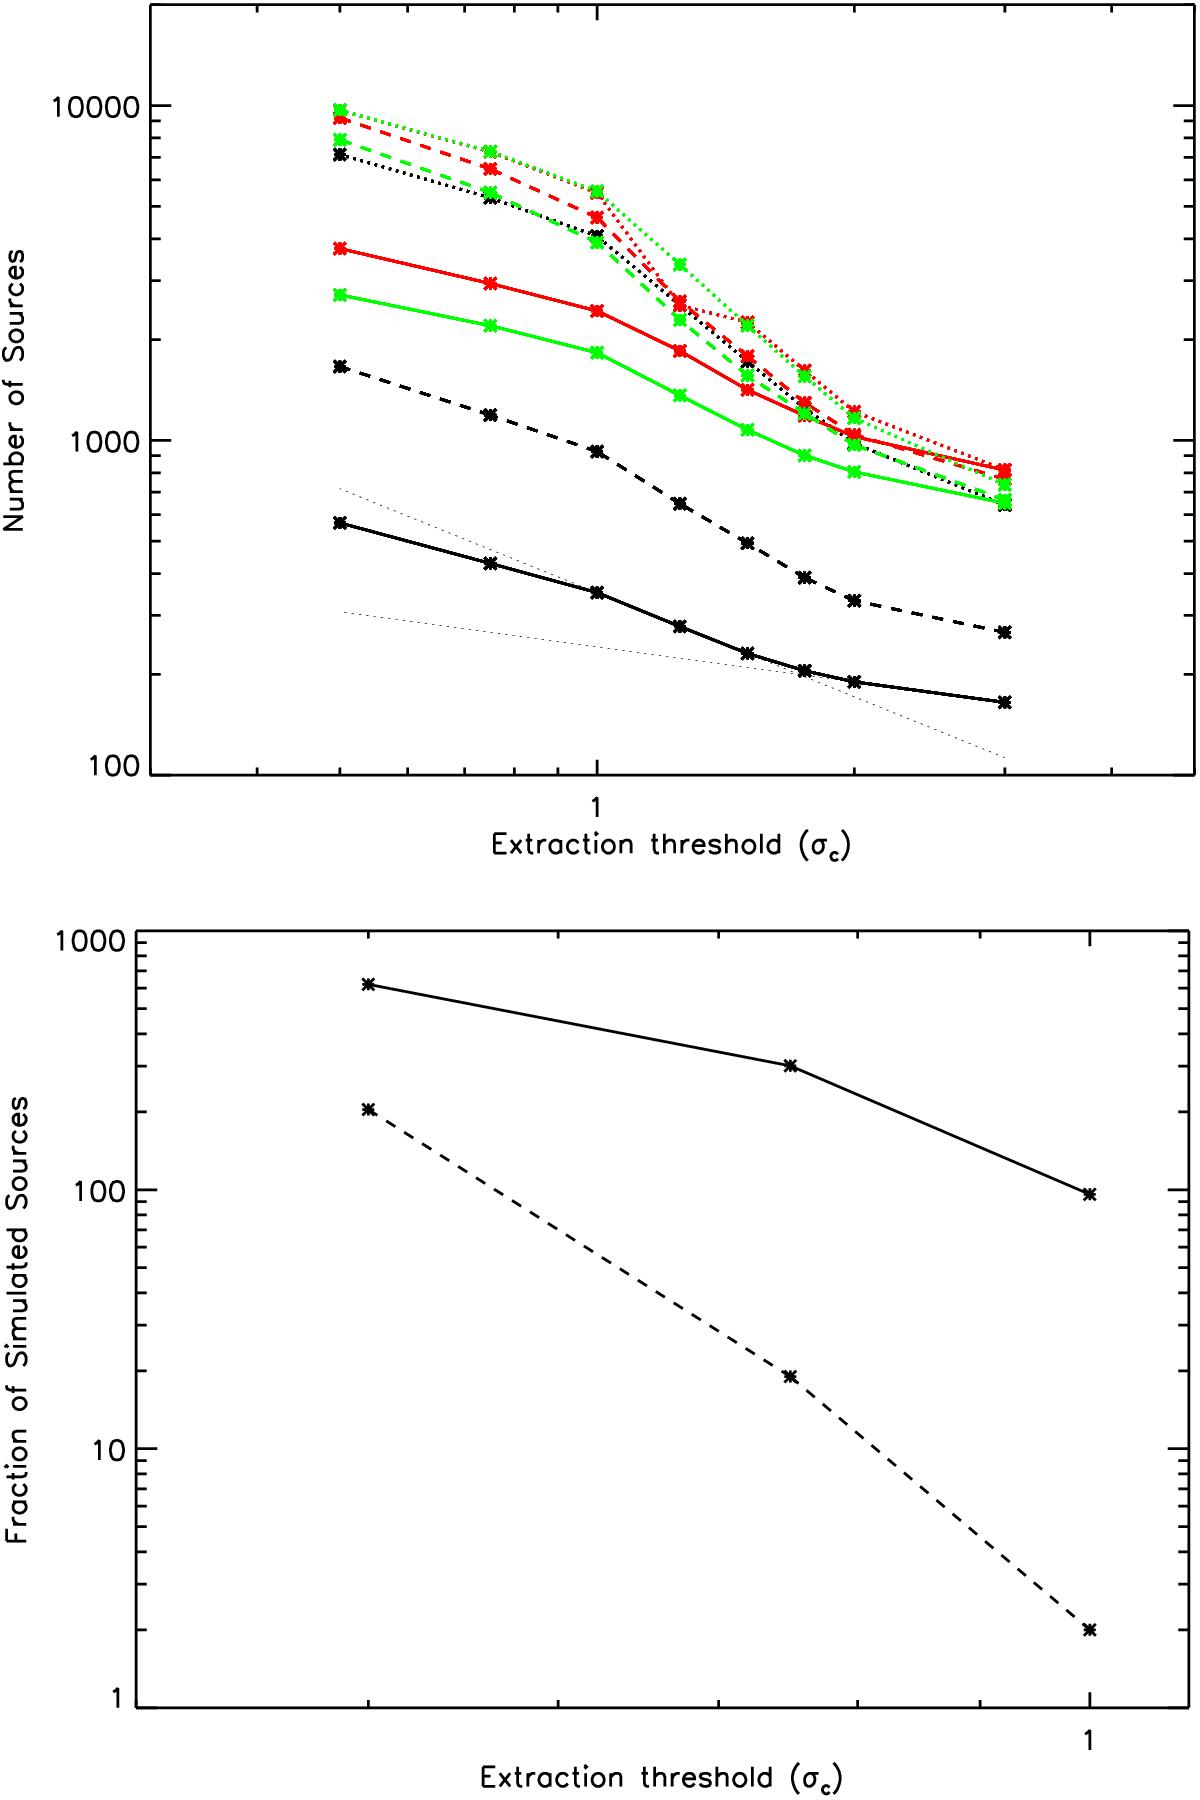
Top panel: number of sources extracted with CuTEx as a function of extraction threshold for the 70 μm (thick solid lines), 160 μm (thick dashed lines), and 250 μm bands (dotted thick lines) for three Hi-GAL tiles with very different background conditions: ℓ = 19° (green lines), ℓ = 30° (red lines) and ℓ = 59° (black lines). The thin dotted lines are power-law fits to the initial and mid portions of the N-σc relationship at 70 μm for the ℓ = 59° tile and are shown to emphasise the change in slope that is visible for all functions for σc ≲ 2. Bottom panel: detection statistics for the simulated source experiments reported in Fig. 7 of Molinari et al. (2011b) for a flux of 0.1 Jy; the total number of simulated sources is 1000. The full line reports the number of true sources recovered, while the dashed line reports the number of false positives as a function of extraction threshold. It is noticeable that the number of false positives increases faster for decreasing thresholds than the number of true sources detected, qualitatively explaining the change of slope in the real field detections (top panel).
Current usage metrics show cumulative count of Article Views (full-text article views including HTML views, PDF and ePub downloads, according to the available data) and Abstracts Views on Vision4Press platform.
Data correspond to usage on the plateform after 2015. The current usage metrics is available 48-96 hours after online publication and is updated daily on week days.
Initial download of the metrics may take a while.


