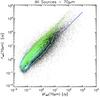
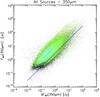
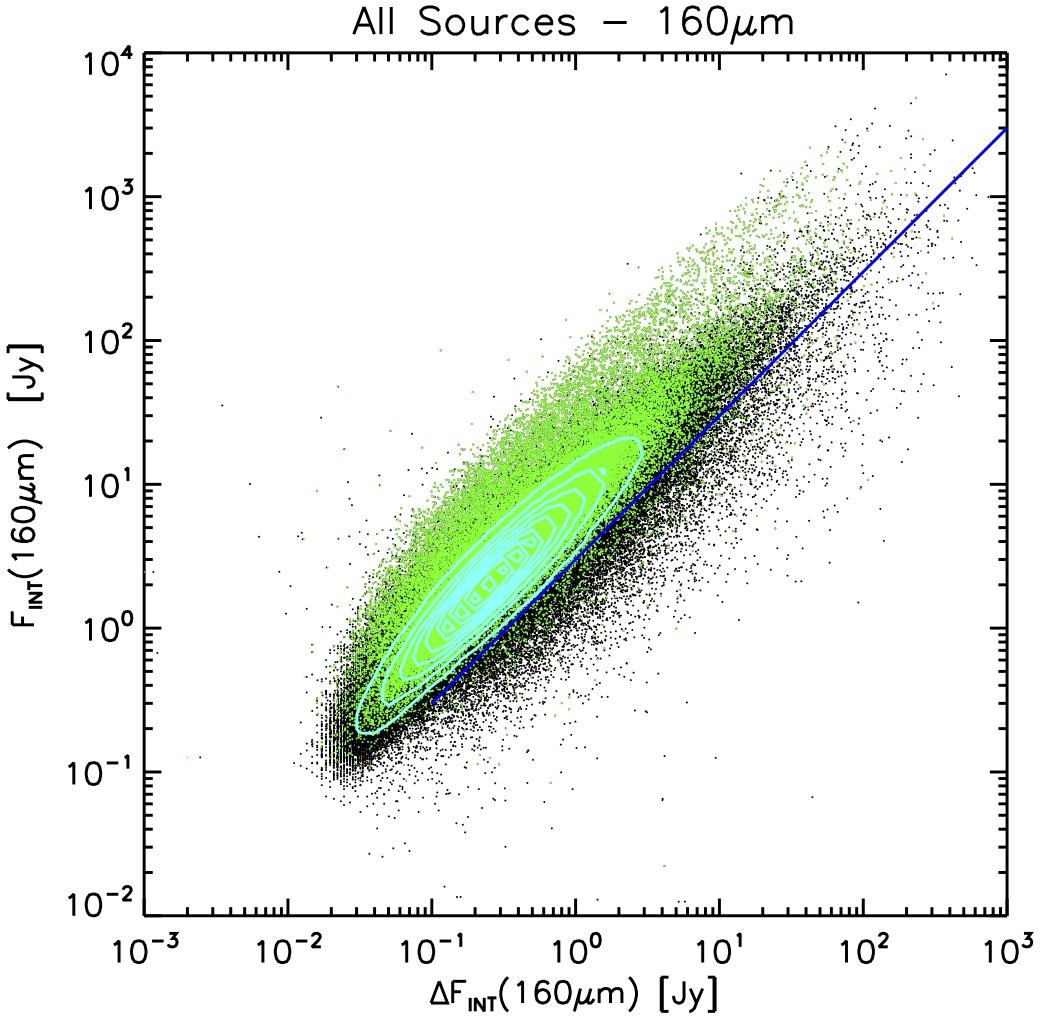
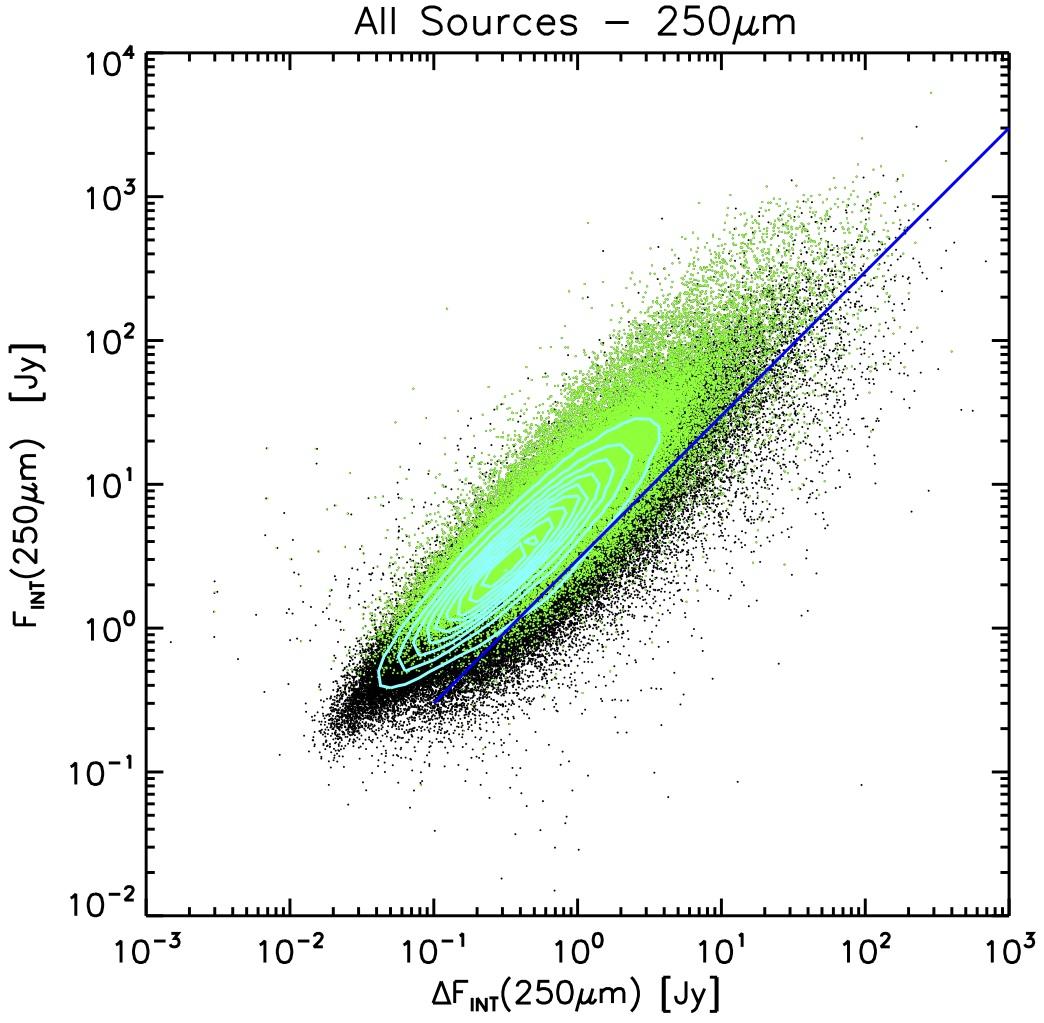
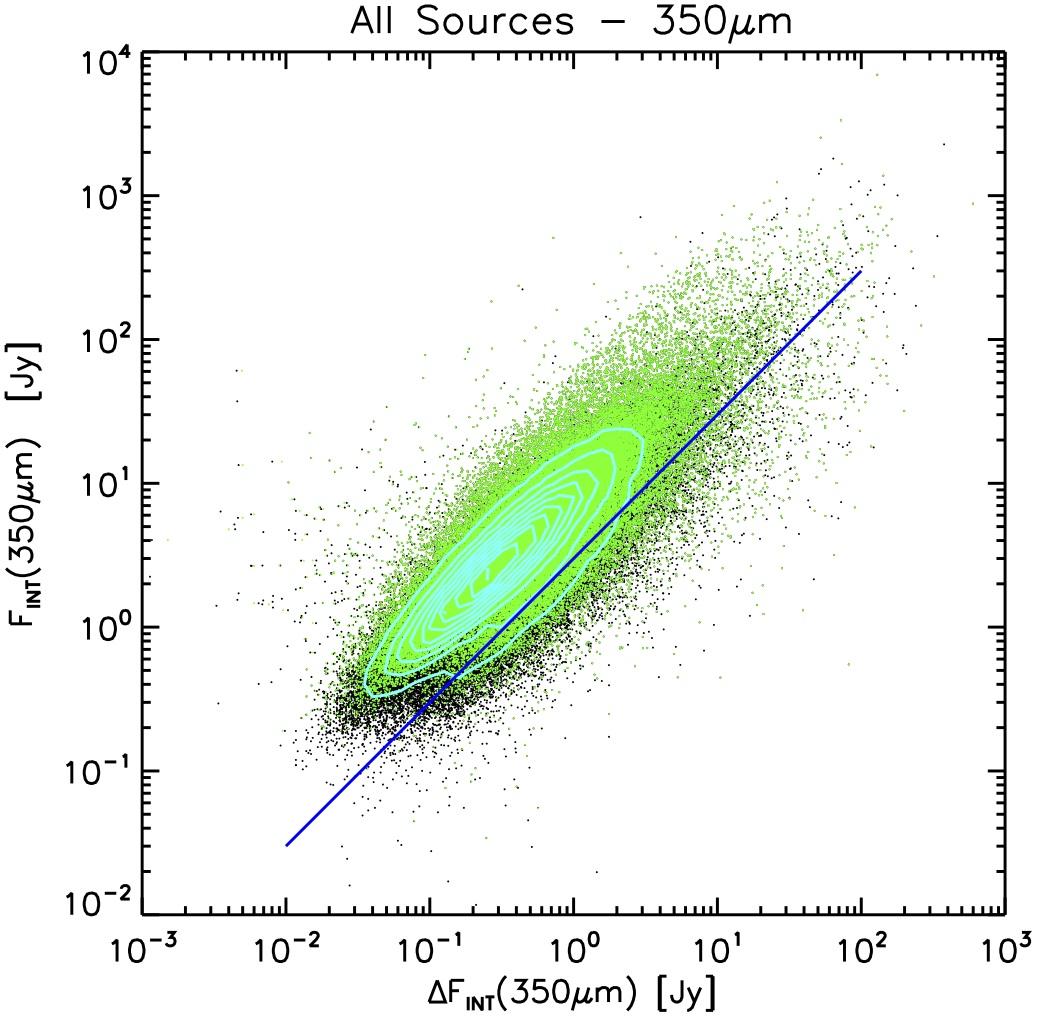
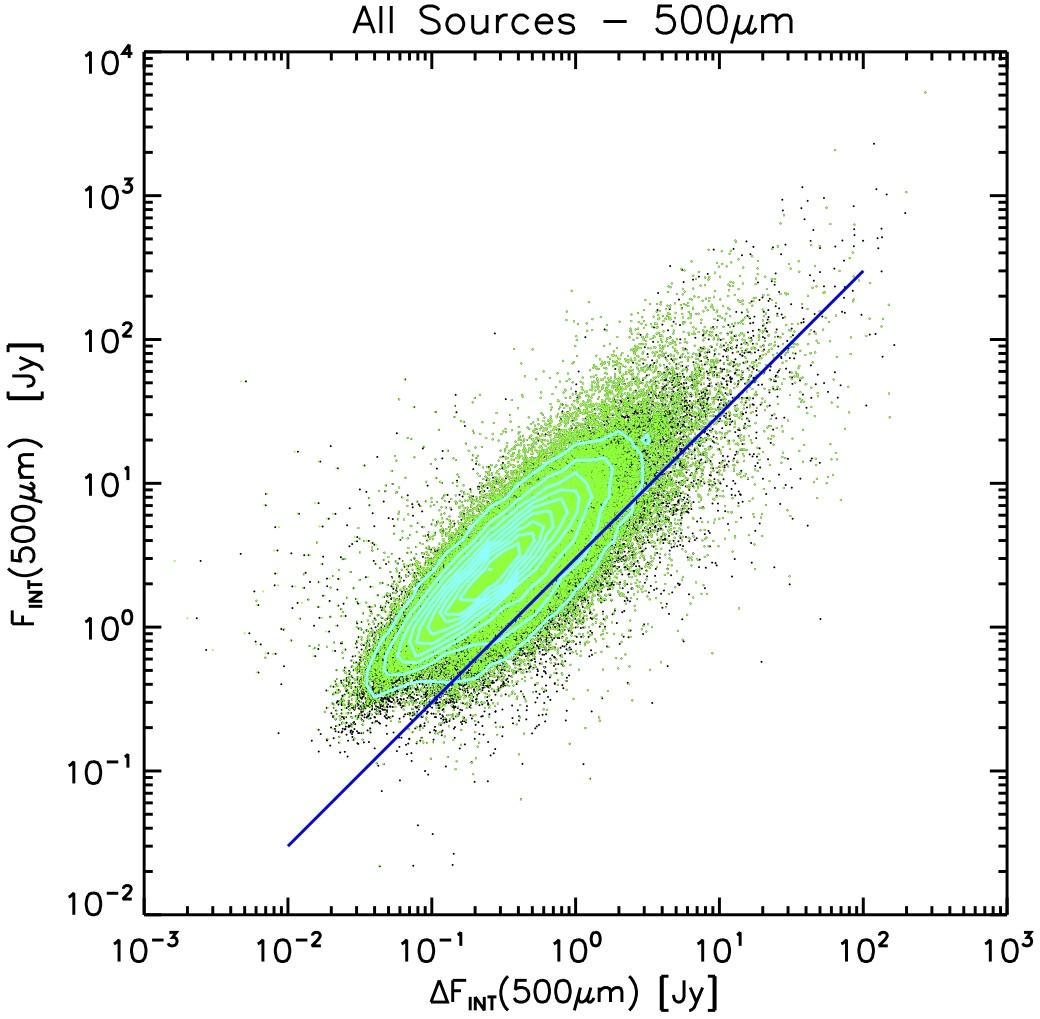
Fig. 16

Integrated flux FInt as a function of its uncertainty ΔFInt for all Hi-GAL bands as indicated. The black points are all the sources in each band catalogue; the ten cyan contours (equally spaced in source density) indicate the source density in the most crowded area. The green points are the subset of sources that possess a counterpart in at least two adjacent bands (so as to form an SED with at least three photometric points, see Elia et al., in prep.). The blue line represents S/NInt = 3.


Current usage metrics show cumulative count of Article Views (full-text article views including HTML views, PDF and ePub downloads, according to the available data) and Abstracts Views on Vision4Press platform.
Data correspond to usage on the plateform after 2015. The current usage metrics is available 48-96 hours after online publication and is updated daily on week days.
Initial download of the metrics may take a while.