Fig. 11
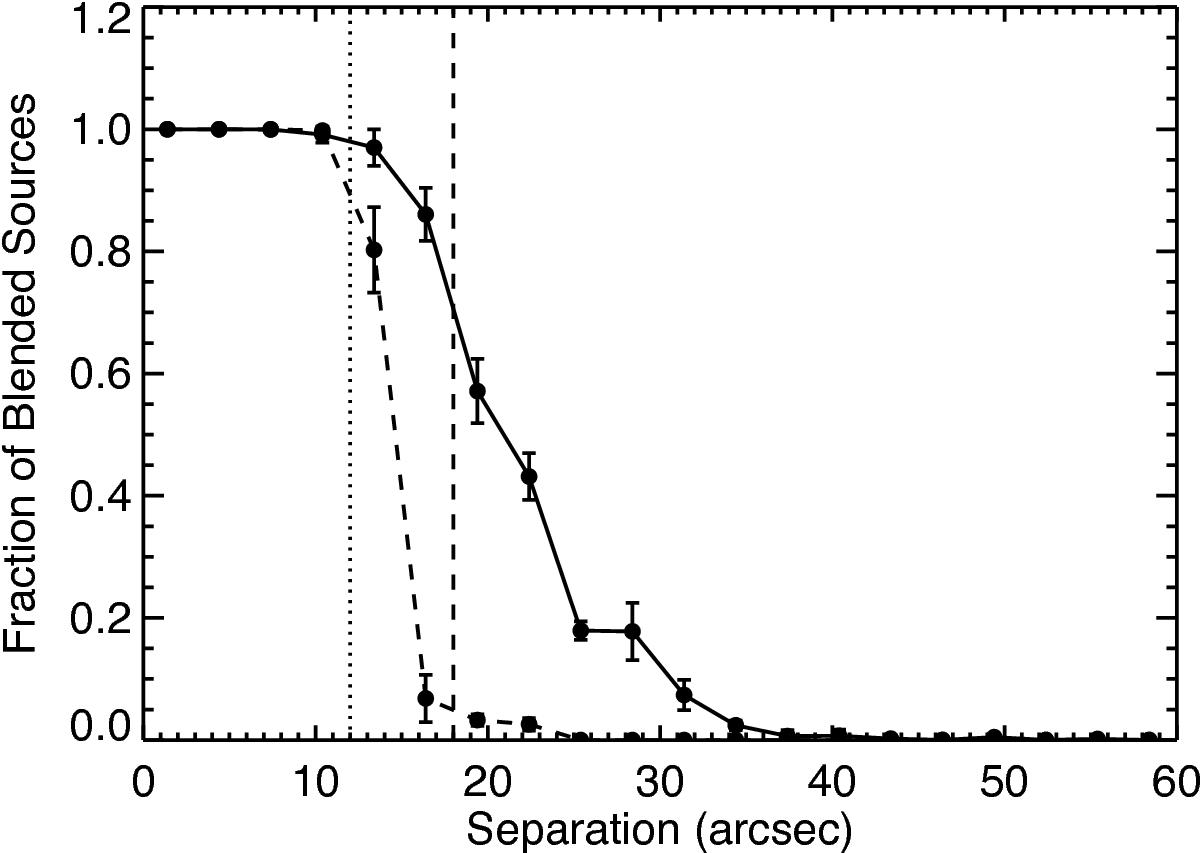
Curves represent the fraction of blended sources that CuTEx is not able to deblend as a function of source separation for a set of synthetic sources described in the text; simulations in this case are made for the 250 μm images. The full and dashed lines are the results for simulations with extended and point-like sources, respectively. Vertical lines represent the size of the beam (dashed), and 75% the size of the beam (dotted).
Current usage metrics show cumulative count of Article Views (full-text article views including HTML views, PDF and ePub downloads, according to the available data) and Abstracts Views on Vision4Press platform.
Data correspond to usage on the plateform after 2015. The current usage metrics is available 48-96 hours after online publication and is updated daily on week days.
Initial download of the metrics may take a while.