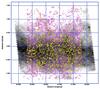
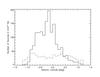
Fig. 10

Upper panel: 250 μm image of the Hi-GAL tile at ℓ = 41°. Superimposed are the sources detected with CuTEx. The yellow crosses indicate the sources with fluxes above the completeness limit, while the magenta crosses indicate the sources with fluxes below the completeness limit. Lower panel: histograms of latitude distributions for 250 μm sources, above (full line) and below (dashed line) the completeness limit.
Current usage metrics show cumulative count of Article Views (full-text article views including HTML views, PDF and ePub downloads, according to the available data) and Abstracts Views on Vision4Press platform.
Data correspond to usage on the plateform after 2015. The current usage metrics is available 48-96 hours after online publication and is updated daily on week days.
Initial download of the metrics may take a while.