Free Access
Fig. 1
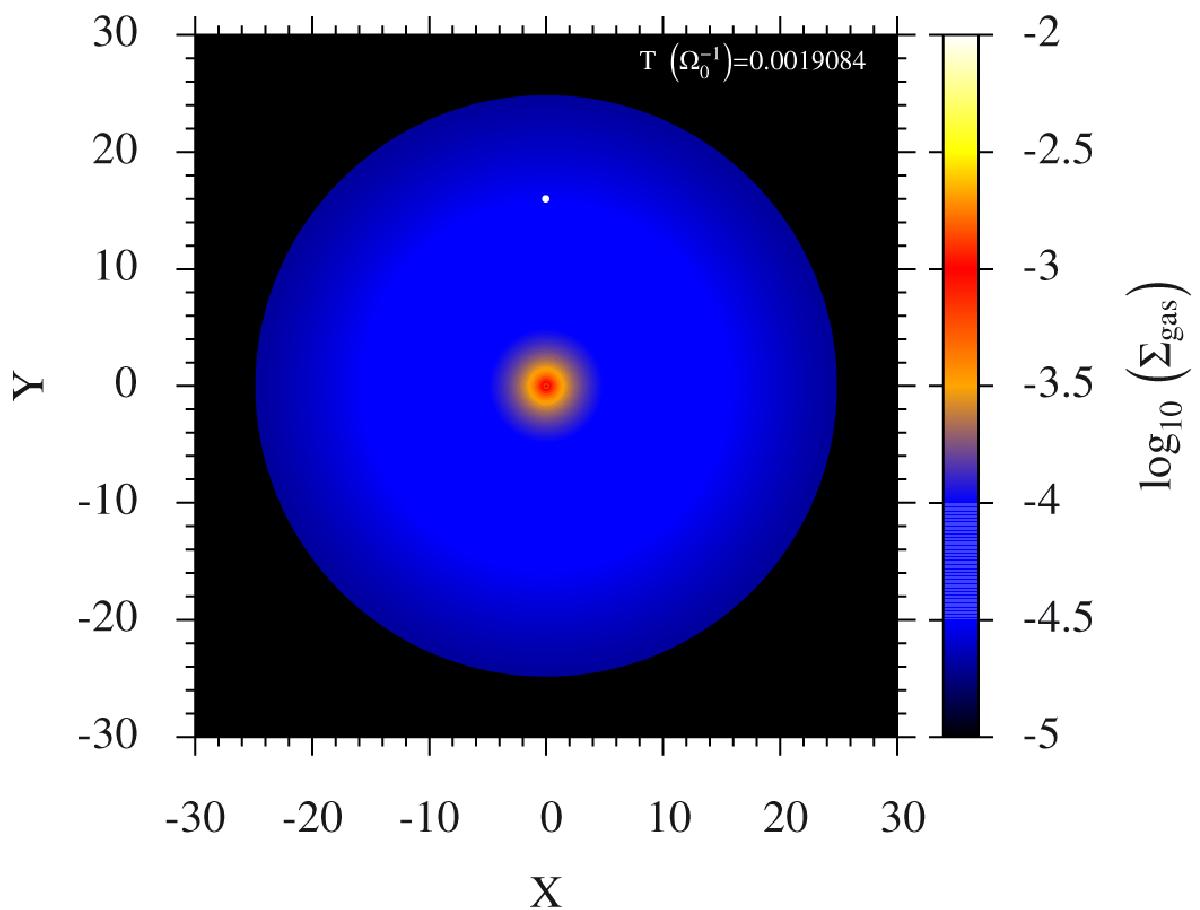
Face-on, color coded map of the disc’s surface density at the onset of each simulation. The position of the secondary is marked with a solid green circle. For all quantities, we use the internal units of the code, except for the time, which is in units of ![]() , i.e., the inverse of the initial binary’s rotational frequency.
, i.e., the inverse of the initial binary’s rotational frequency.
Current usage metrics show cumulative count of Article Views (full-text article views including HTML views, PDF and ePub downloads, according to the available data) and Abstracts Views on Vision4Press platform.
Data correspond to usage on the plateform after 2015. The current usage metrics is available 48-96 hours after online publication and is updated daily on week days.
Initial download of the metrics may take a while.